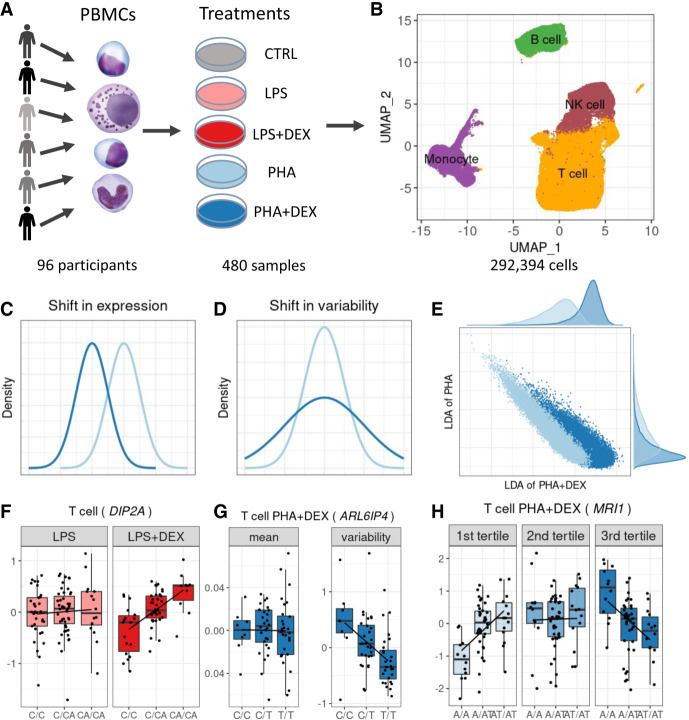
Figure 1.
Study overview. (A) PBMCs were collected from 96 African American donors with asthma. Cells were stimulated with phytohemagglutinin (PHA) or lipopolysaccharide (LPS) and treated with glucocorticoid dexamethasone (DEX) for a total of five conditions (including a control), for a total of 480 samples. (B) UMAP visualization of the scRNA data for a total of 293,394 high-quality cells, colored by four major cell types: B cells (green), monocytes (purple), NK cells (maroon), and T cells (orange). (C) Density plot exemplifying changes in mean gene expression between conditions (PHA + DEX vs. PHA). (D) Density plot exemplifying changes in gene variability between conditions (PHA + DEX vs. PHA). (E) Scatterplot representing the low-dimensional manifolds obtained by diagonal linear discriminant analysis (DLDA) in the T cells treated with PHA and PHA + DEX; x-axis denotes the PHA + DEX response pseudotime, and y-axis denotes the PHA response pseudotime. (F) Example of an LPS + DEX response eQTL (reQTL) for DIP2A gene in the T cells. The boxplots depict normalized gene expression levels for the three genotype classes in the two treatment conditions contrasted to identify the reQTL: LPS + DEX (right) and LPS (left). (G) Example of a variability QTL without an effect on the mean gene expression for the ARL6IP4 gene in T cells treated with PHA + DEX. The boxplots depict normalized variability (right) and mean (left) gene expression for the three genotype classes. (H) Example of a DEX response dynamic eQTL for the MRI1 gene in the T cells treated with PHA + DEX.

