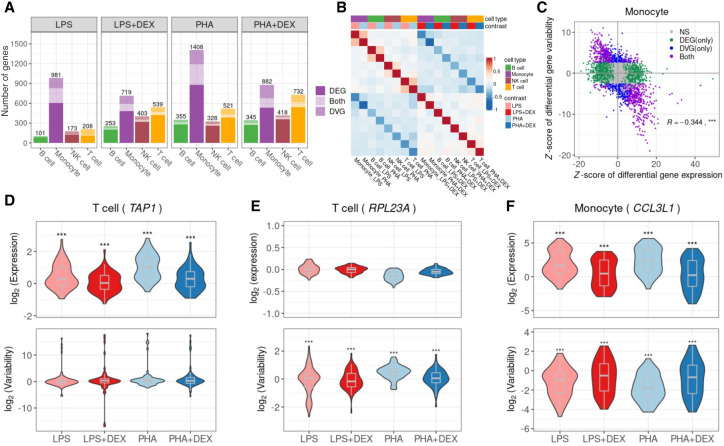
Figure 3.
Identification of differentially variable genes (DVGs). (A) Number of the genes with differential mean or variability across cell types and contrasts: genes with significant changes on gene mean only (dark shading), genes with significant changes on gene variability only (medium shading), and genes with significant changes on both gene mean and gene variability (light shading). (B) Heatmap of Spearman's correlation of LFC of gene variability across 16 conditions (four cell types × four contrasts). (C) Scatterplot of the Z-score of differential gene expression (x-axis) and the Z-score of differential gene variability (y-axis) in monocytes across four contrasts. Each dot represents a gene with colors indicating significant (FDR < 10%) changes on gene mean expression only (green), gene variability only (blue), both (purple), and neither (gray). (D) Violin plot of gene expression variability (bottom) and mean expression (top) for the gene (TAP1), an example of a gene that undergoes significant changes only to gene expression in response to immune treatments in T cells. (E) Violin plot of gene expression variability (bottom) and mean expression (top) of the gene (RPL23A), which does not show significant changes in gene expression mean but with significant changes in gene expression variability after immune treatment in T cells. (F) Violin plot of gene expression variability (bottom) and mean expression (top) of the gene (CCL3L1), which shows changes in both gene expression mean and gene expression variability after immune treatment in monocytes.

