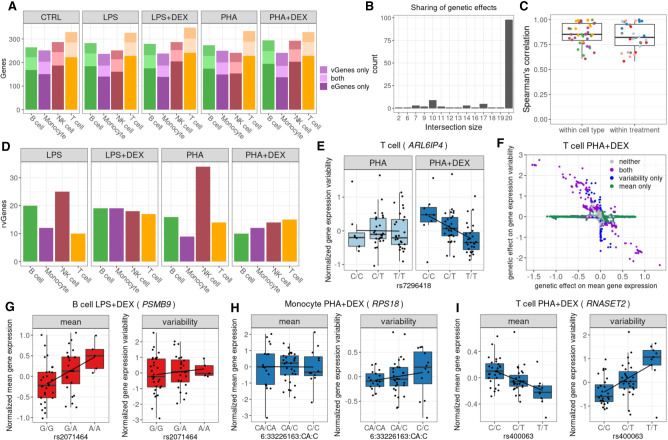
Figure 6.
Genetic effects on gene expression variability. (A) Barplot of the number of genes with eQTLs (eGenes) for which we did not detect genetic effects on variability (dark shading), number of genes with vQTLs (vGenes) for which we did not detect any genetic effects on gene expression (medium shading), and genes with both eQTLs and vQTLs (light shading). (B) Boxplot of the Spearman's correlations between significant genetic effects on gene expression variability for each pairwise comparison of two treatment conditions within each cell type and for each pairwise comparison of two cell types within each treatment condition; color reflects cell types (as in A) or treatment: control (gray), LPS (pink), LPS + DEX (red), PHA (light blue), and PHA + DEX (dark blue). (C) Barplot of the number of vGenes (y-axis) with genetic effects in the same direction across the number of conditions shared (x-axis). (D) Barplot of the number of genes with response vQTLs (rvGenes). (E) Boxplot of normalized gene expression variability for ARL6IP4 gene in T cells treated with PHA (left) or PHA + DEX (right) across the three genotype classes of the vQTL rs7296418 (x-axis). (F) Scatterplot of genetic effects on mean gene expression (x-axis) versus genetic effects on gene expression variability (y-axis) for T cells treated with PHA + DEX; color represents genetic variants with significant effects on mean gene expression only (green), gene expression variability only (blue), both (purple), and neither (gray). (G) Boxplot of normalized mean gene expression (left) and normalized gene expression variability (right) for PSMB9 gene in B cells treated with LPS + DEX, with significant genetic effect of rs2071464 on mean gene expression but no effect on gene expression variability. (H) Boxplot of normalized mean gene expression (left) and normalized gene expression variability (right) for RPS18 gene in monocytes treated with PHA + DEX, with significant genetic effect of rs1197452483 on gene expression variability but no effect on mean gene expression. (I) Boxplot of normalized mean gene expression (left) and normalized gene expression variability (right) for RNASET2 gene in T cells treated with PHA + DEX, with significant genetic effect of rs400063 both on mean gene expression and on gene expression variability.

