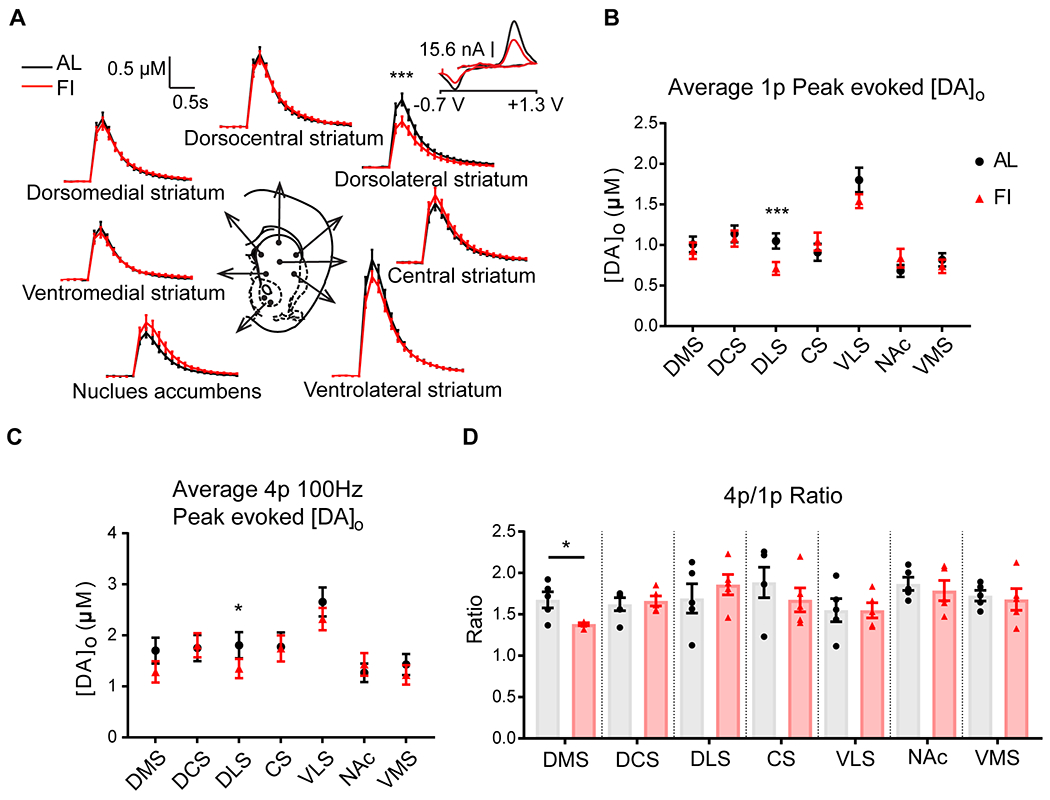
Figure 7. In male mice, developmental feeding history affected evoked dopamine release in the dorsal striatum in adulthood.

A, Evoked dopamine release [DA]o in striatal subregions showing single pulse (1p) data. Inset, cyclic voltammogram shows characteristic dopamine waveforms. B, Quantification of peak [DA]o by 1p stimulation. N= 17-32 transients per site from 5 mice per group. The evoked peak [DA]o in the DLS was significantly lower in the FI group compared to the AL group. C, Peak [DA]o by a 4p train 100 Hz stimulation. N= 9-16 transients per site from 5 mice per group. The evoked peak [DA]o in the DLS was significantly lower in the FI group. D, Ratio of 4p/1p peak [DA]o. The 4p/1p ratio in the DMS was significantly lower in the FI group compared to the AL group. See also Figure S6. Paired two-tailed t-test. Slices were paired such that one FI and one AL brain were recorded using the same electrode on the same day. *p<0.05, **p<0.01, ***p<0.001. DMS, dorsomedial striatum. DCS, dorsocentral striatum; DLS, dorsolateral striatum. CS, central striatum. VLS, ventrolateral striatum. NAc, nucleus accumbens. VMS, ventromedial striatum. Data are represented as mean ± SEM.
