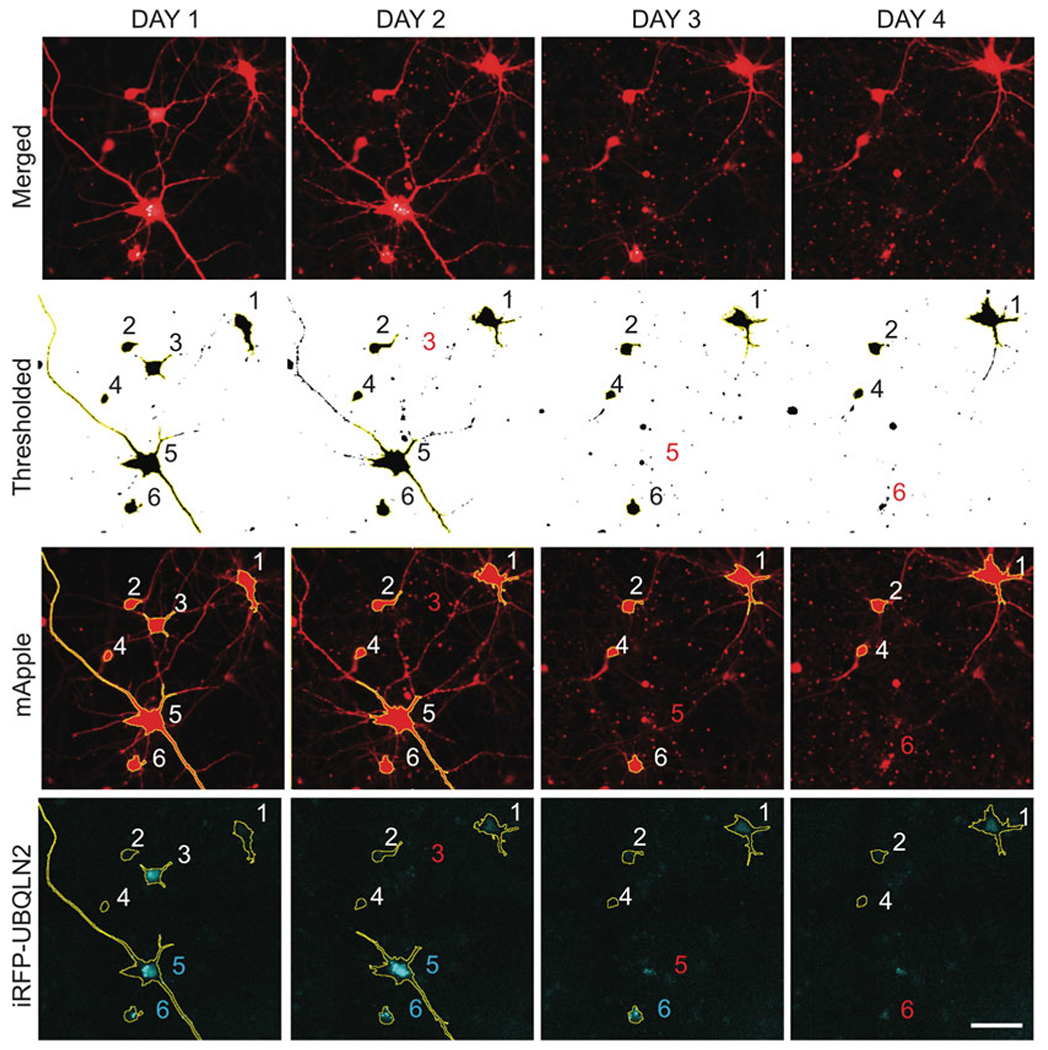
Fig. 1.

ROI identification for neurons coexpressing mApple (red) and iRFP-UBQLN2 (cyan). mApple channel images are thresholded using the “minimum dark” option. FIJI’s “Analyze Particles” tool is then used to superimpose ROIs onto objects larger than the “min_cell_area” specified by the user. These ROIs are saved to FIJI’s ROI manager and overlayed onto the iRFP channel to measure single-cell iRFP-UBQLN2 fluorescence intensity and standard deviation. Red numbers specify cell death. Cyan numbers indicate neurons with UBQLN2 puncta. Scale bar = 100 μm
