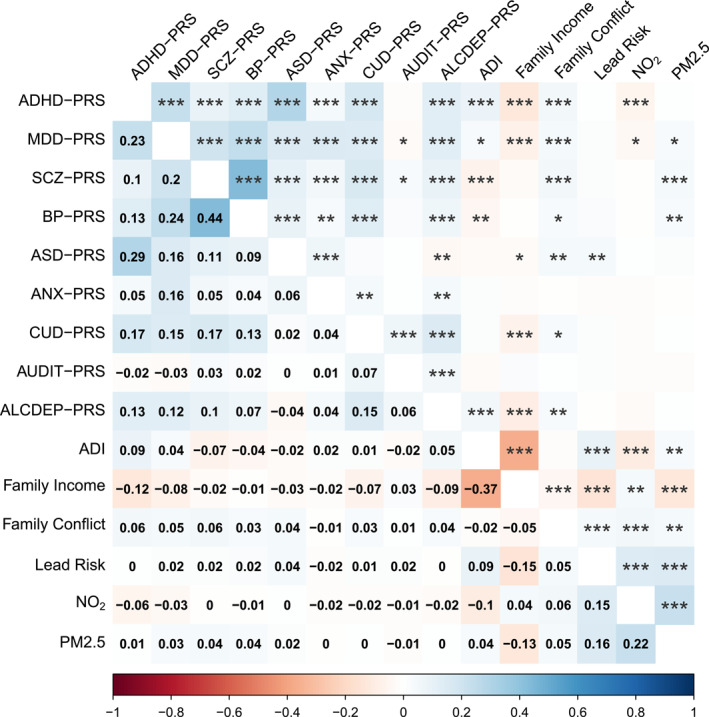
FIGURE 1.

Correlation matrix of PRS and exposures for the European‐ancestry subgroup of the ABCD cohort. Correlation coefficients are shown in the lower triangle and significance codes in the upper triangle, with *, **, and *** representing p < .05, p < .01, and p < .001, respectively. ABCD, Adolescent Brain Cognitive Development Study; PRS, polygenic risk score.
