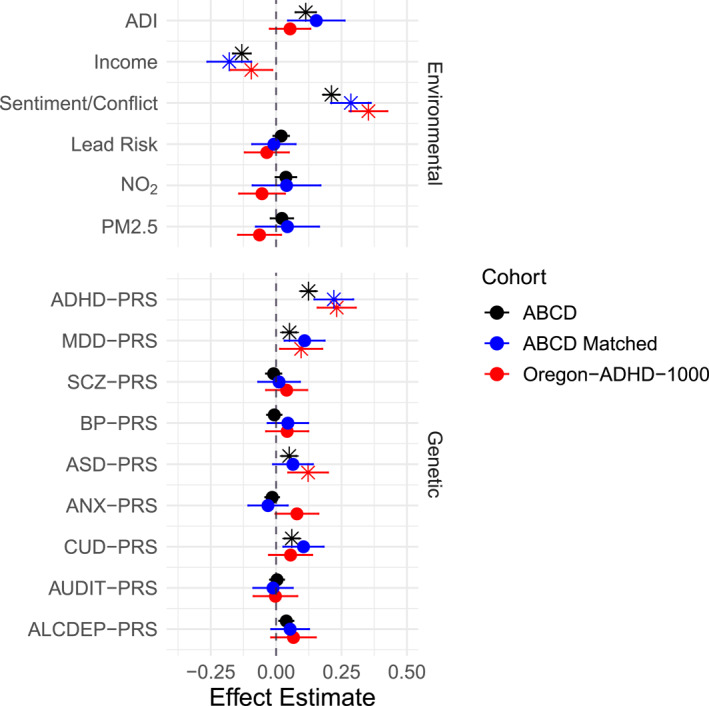
FIGURE 2.

Univariate main effects (standardized regression coefficient) of all exposures and PRS on total ADHD symptoms for the European‐ancestry subsamples in each cohort. Point estimates indicated with an asterisk (*) are either (a) statistically significant after multiple‐testing correction in ABCD, or (b) significantly replicated in the Oregon‐ADHD‐1000 (p < .05). Total ADHD symptoms were measured with the CBCL ADHD DSM‐oriented scale in ABCD, and the ADHD Rating Scale in the Oregon‐ADHD‐1000 cohort. ABCD, Adolescent Brain Cognitive Development Study; ADHD, attention‐deficit/hyperactivity disorder; CBCL, Child Behavior Checklist; PRS, polygenic risk score.
