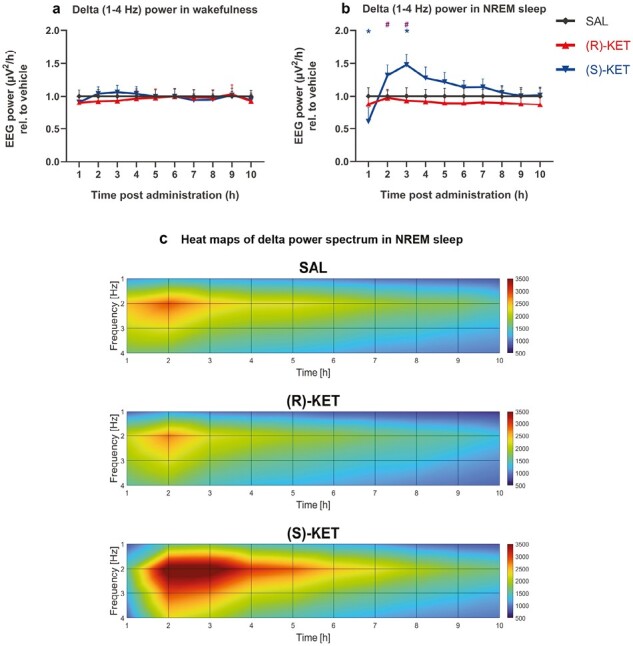
Figure 3.

Delta (1-4 Hz) EEG power changes induced by (R)-ketamine [15 mg/kg i.p., (R)-KET] and (S)-ketamine [15 mg/kg i.p., (S)-KET] during wakefulness, and NREM sleep. Delta power of the two compounds compared with saline in wakefulness are shown in A and in NREM sleep in B. Significant results are indicated by * of the appropriate color (compared with vehicle, P < .05) and # (between the enantiomers, P < .05). Data are shown as mean ± SEM (n = 8 rats per group). Heat maps for saline, (R)-ketamine and (S)-ketamine treatment, as a function of time and frequency are shown in C.
