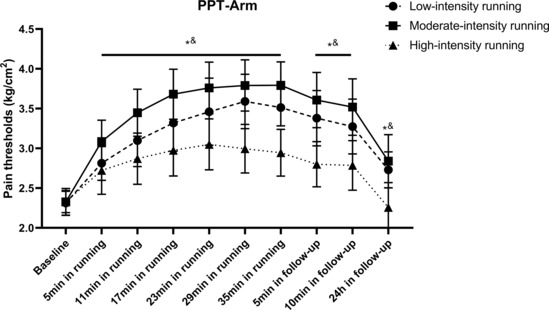
FIGURE 3.

Changes in PPT of arms following running. All data were presented as mean and standard deviation; PPT, pressure pain threshold. *PPT in low‐intensity group significantly higher than high‐intensity group. &PPT in moderate‐intensity group significantly higher than high‐intensity group.
