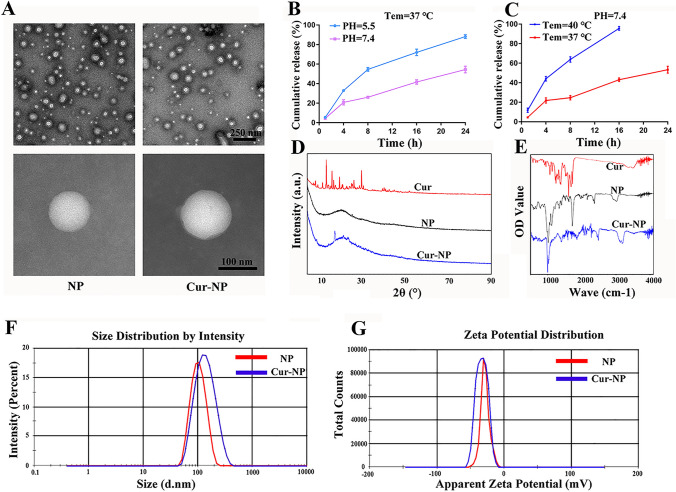
Fig. 1.
Characterization of NPs and Cur-NPs. A TEM images of NPs and Cur-NPs. B The release of curcumin from micelle NPs at different pH conditions and time points (1, 4, 8, 16, and 24 h). C The release of curcumin from micelle NPs at different temperature conditions and time points (1, 4, 8, 16, and 24 h). D XRD spectroscopy analysis of free curcumin, NPs, and Cur-NPs. E FTIR spectroscopy detection of free curcumin, NPs, and Cur-NPs. F Zeta potential analysis of NPs and Cur-NPs. G The particle size distribution of NPs and Cur-NPs

