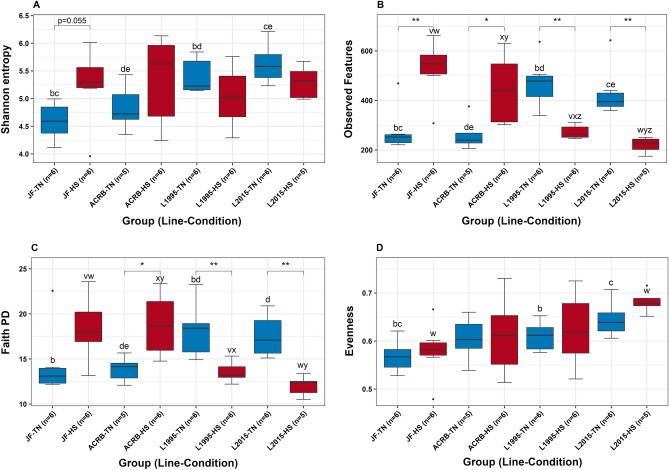
Figure 1.
Comparisons of CeL microbiota alpha diversity: (A) Shannon diversity, (B) observed features (richness), (C) Faith’s Phylogenetic Diversity (Faith PD, richness), and (D) evenness. Stars denote statistically significant (*P < 0.05, **P < 0.01) differences. Letters a–f above boxes indicate significant differences between genetic lines of TN groups (a = JF and ACRB, b = JF and L1995, c = JF and L2015, d = ACRB and L1995, e = ACRB and L2015, f = L1995 and L2015). Letters u–z above boxes indicate significant differences between genetic lines of HS groups (u = JF and ACRB, v = JF and L1995, w = JF and L2015, x = ACRB and L1995, y = ACRB and L2015, z = L1995 and L2015).

