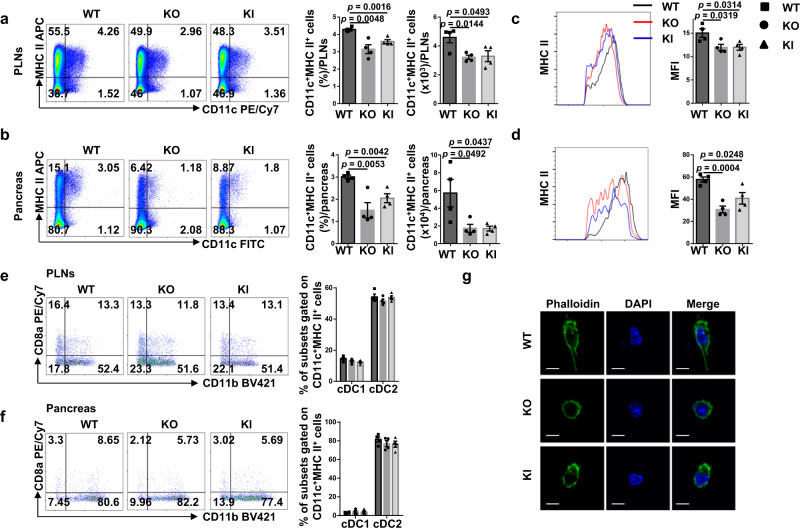
Fig. 3. The effect of ALR Myo9b KI and Myo9b deficiency on DCs in the PLNs and pancreas.
a–f Flow cytometry analysis of PLN and pancreas cells from 10- to 12-week-old WT, KO, and KI mice (n = 4 for each group). a, b Representative flow cytometry plots, frequencies, and cell numbers of CD11c+MHC II+ cells in the PLNs (a) and pancreas (b). c, d MHC II expression in CD11c+MHC II+ cells from the PLNs (c) and pancreas (d) shown as MFI. e, f Representative flow cytometry plots and frequencies of CD8a+CD11b− cDC1 and CD8a−CD11b+ cDC2 gated on CD11c+MHC II+ cells in the PLNs (e) and pancreas (f). g Fluorescence images of DCs isolated from pancreatic islets and labeled with FITC-Phalloidin. Scale bars: 10 μm. Values are presented as mean ± SEM. Significance was determined by one-way ANOVA. PLNs pancreatic lymph nodes, MFI mean fluorescence intensity.

