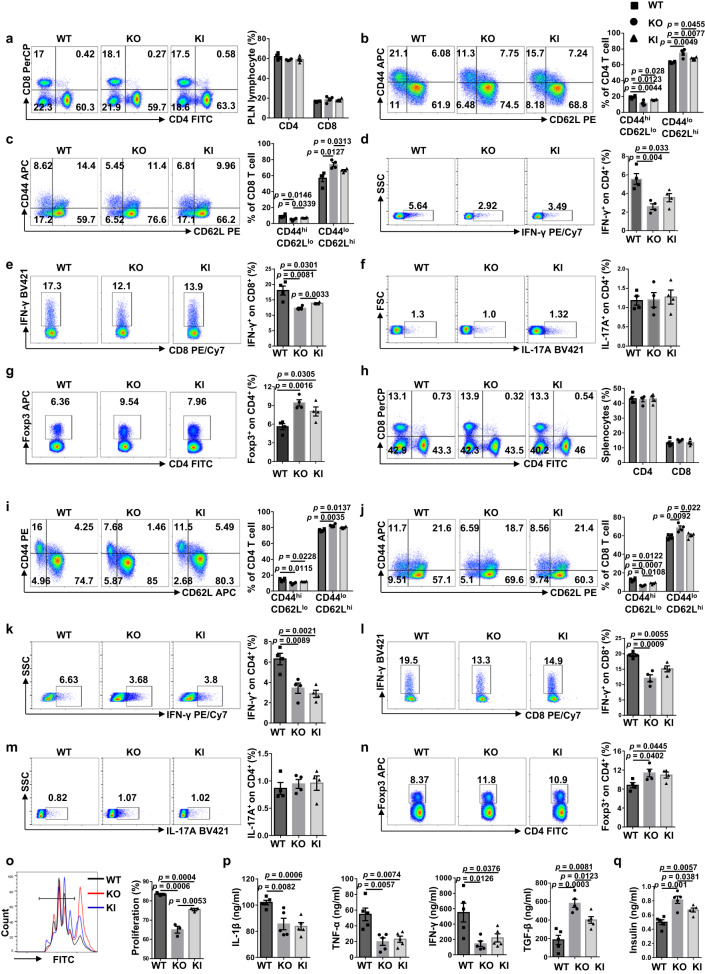
Fig. 5. ALR Myo9b KI and Myo9b deficiency result in decreased prevalence of effector T cells and increased Treg cells in the PLNs and spleen.
a–g PLN cells from 10- to 12-week-old WT, KO and KI mice were harvested and subjected to flow cytometry analysis. Representative FACS plots and frequencies of CD4+ and CD8+ T cells (a), CD4+CD44highCD62Llo and CD4+CD44loCD62Lhigh effector/naive T cells (b), CD8+ effector/naive T cells (c), CD4+IFN-γ+ (Th1) (d), CD8+IFN-γ+ (Tc1) (e), CD4+IL-17A+ (Th17) (f), and CD4+Foxp3+ (Treg) (g) subpopulations are shown. h–n Splenocytes from 10- to 12-week-old WT, KO and KI mice were harvested and subject to flow cytometry analysis. Representative FACS plots and frequencies of CD4+ and CD8+ T cells (h), CD4+ effector/naive T cells (i), CD8+ effector/naive T cells (j), Th1 (k), Tc1 (l), Th17 (m), and Treg (n) subpopulations are shown. o Peripheral Treg cells sorted from WT, KO and KI mice were co-cultured with CFSE-labeled WT CD4+CD25− conventional T cells in the presence of anti-CD3/CD28. CFSE dilution was analyzed by flow cytometry after 72 h, and the percentage of proliferated cells was shown. The experiment was repeated independently three times. p Analysis of serum cytokine levels in 12-week-old WT, KO, and KI mice. q Serum insulin levels determined in 12-week-old WT, KO and KI mice. n = 4 (a–n) or 5 (p, q) in each study group. Values are expressed as mean ± SEM. Statistical difference was determined by one-way ANOVA.

