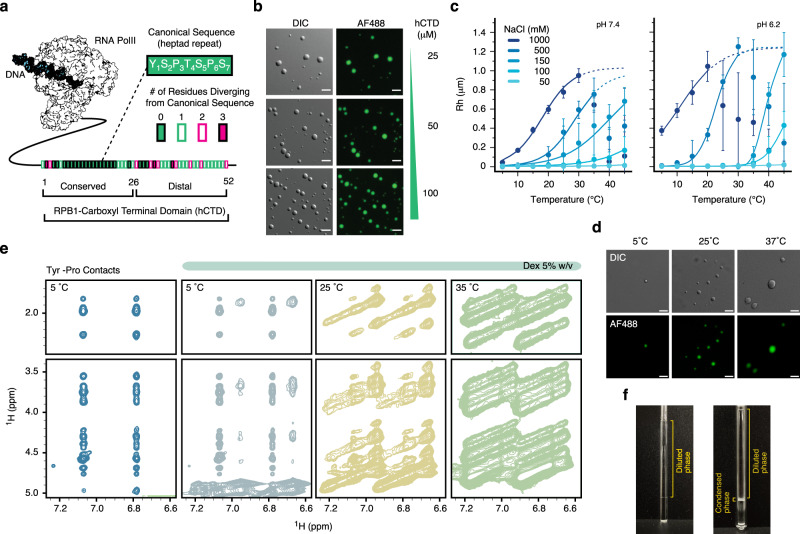
Fig. 1. Phase separation of human CTD.
a Schematic representation of human RNA Pol II illustrating the conserved heptad repeats YSPTSPS of the CTD of RPB1, the largest subunit of Pol II. Variations from the YSPTSPS repeat sequence are color coded. b Micrographs demonstrating concentration-sensitive phase separation of hCTD in the absence of molecular crowding agents (300 mM NaCl, 25 mM HEPES, 1.0 mM TCEP, pH 7.4). c Influence of temperature, pH, and ionic strength to induce hCTD phase separation (in 25 mM HEPES, 1.0 mM TCEP) monitored by dynamic light scattering. No crowding agents were used. Solid lines represent sigmoidal regression; dotted lines indicate tendencies in conditions where sedimentation occurred. Dots represent mean values (n = 3) and error bars represent ± std for independent measurements. d Droplet morphologies of hCTD (25 μM) in high salt conditions. The pictures correspond to 1 M NaCl in 25 mM HEPES, 1.0 mM TCEP (pH 7.4) at three different temperatures. e, f Interresidue contacts in two-dimensional 1H-1H NOESY spectra of yCTD in isotropic mixed conditions (5 °C without dextran; blue) and in conditions of phase separation (5 % dextran and increasing temperature). Cross-peaks between aromatic Tyr protons and aliphatic side-chain protons (vertical scale) are displayed in (e). The NMR tubes in (f) show the formation of a macroscopic condensate prior to recording the NOESY spectra in the presence of dextran and increased temperature. Micrographs are representative of 3 independent biological replicates. Scale bar, 5 µm.

