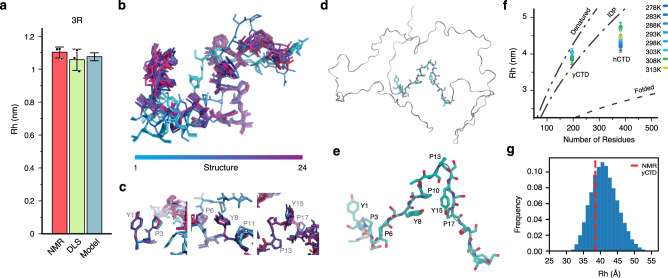
Fig. 3. CTD structure in the dilute phase.
a Hydrodynamic radius Rh of 3R-CTD from NMR, DLS, and the ensemble of structures shown in (b). Error bars in panel (a) represent two times std. b, c Ensemble of low energy structures of 3R-CTD calculated with Rosetta using NMR restraints. Individual structures are colored from blue to purple. Contacts between Pro and Tyr residues are highlighted in (c). d, e Selected structure of yCTD from the ensemble of yCTD conformations generated by hierarchical chain growth (HCG) with the help of NMR data. A 21-residue fragment comprising three conserved heptad repeats is shown with side-chains. Residue numbering in (e) starts with the N-terminal Tyr of the 21-residue fragment. f Hydrodynamic radii Rh of hCTD and yCTD at increasing temperatures in the dilute phase (25 μM concentration of hCTD/yCTD). Error bars represent two times std for independent NMR diffusion measurements (n = 3). The curves describe the predicted tendency of Rh as a function of the number of residues for fully denatured, intrinsically disordered (IDP), and folded proteins24. g Histogram distribution of Rh values for the HCG structures of yCTD compared with the experimental value at 5 °C (red dashed line).

