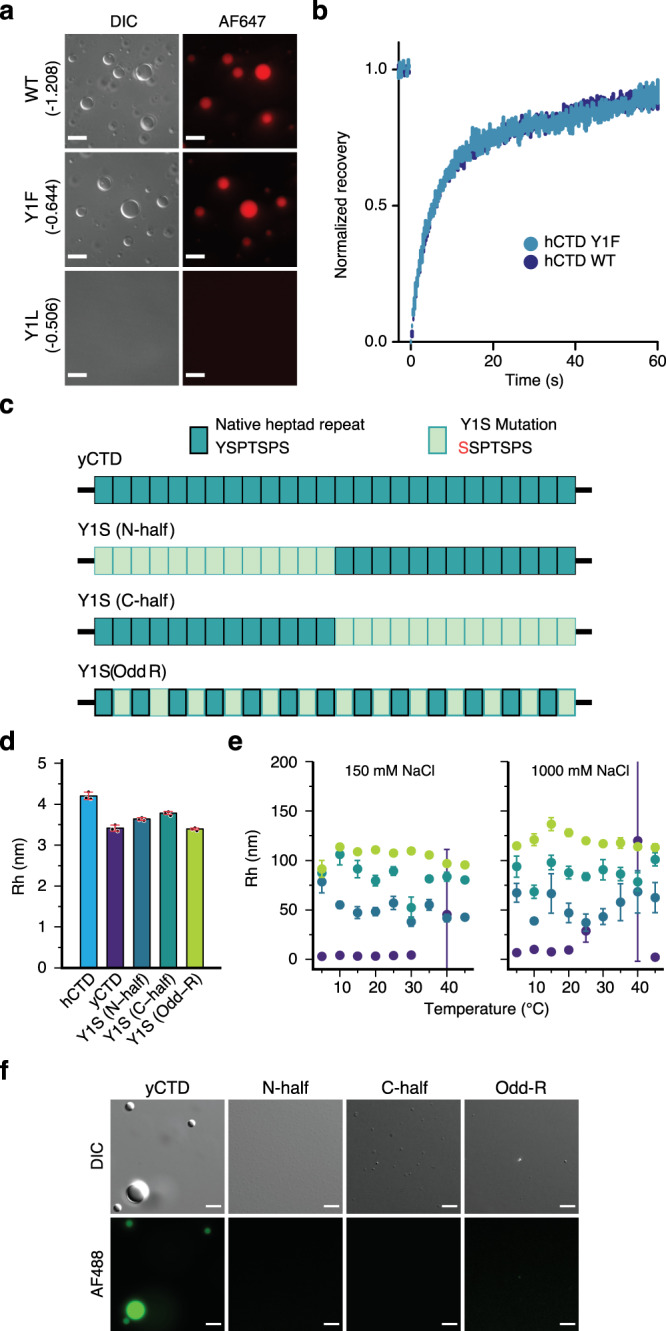
Fig. 4. Contribution of tyrosine residues to CTD phase separation.

a Micrographs of wild-type (WT) hCTD and variants in which all Tyr residues were replaced by phenylalanine (Y1F) or leucine (Y1L). Wild-type CTD and the Y1F variant, but not the Y1L variant, form droplets at a concentration of 20 μM in the presence of 16% w/v dextran. Scale bar, 10 μm. The GRAVY score25, indicating the hydrophobic character of each construct, is shown in parenthesis; a higher value indicates stronger hydrophobicity. b Superposition of the fluorescence recovery curves (n = 5) of wild-type hCTD (blue) and the variant Y1F (cyan). Curves show the average normalized recovery (mean ± standard error). c–f Influence of the distribution of Tyr residues on yCTD phase separation. Three different variants were analyzed, in which either the Tyr residues in the N-terminal half (Y1S (N-half)) or the C-terminal half (Y1S (C-half)) or every second Tyr (Y1S (Odd-R)) were replaced by Ser (schematically shown in (c)). Panel (d) compares the mean (n = 3) hydrodynamic radii of the three constructs with wild-type yCTD as determined by diffusion NMR in the dilute phase (5 °C; protein concentration 100 μM). Error bars in (d) represent two times std. Hydrodynamic radii of Y1S variants of yCTD in phase separation-promoting conditions (100 μM each and pH 7.4) for two different NaCl concentrations are shown in (e) (mean ± std). Wild-type yCTD (purple) starts to form droplets at >25 °C. Error bars in (e) represent std for independent measurements (n = 3). Variants in the columns of panel (f) were fluorescently labeled with Alexa Fluor 488 (AF488) and tested for phase separation by microscopy at similar conditions as shown in panel (e) (150 mM NaCl). Scale bar, 5 μm. Micrographs in panel (a) and (f) are representative of 3 independent biological replicates.
