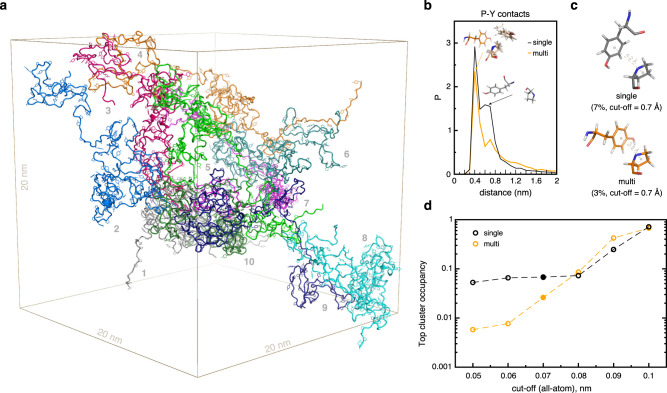
Fig. 6. Analysis of intermolecular tyrosine-proline interactions in MD simulations.
a Visualization of the MD simulation box for the multi-copy system (10 protein copies). Each protein copy is colored differently and is labeled with a number. Proteins are shown in cartoon representation with Pro and Tyr side-chains in stick representation. b Distribution of distances between Pro and Tyr rings in a subset of Pro and Tyr pairs with contact frequency above 10%. Representative configurations (central structures of structural clusters) of Tyr-Pro pairs in single-copy (single) and multi-copy (multi) systems are shown in relation to the actual distance between the residues. c Representative configurations of Tyr-Pro pairs for the most highly populated (top) structural clusters with the applied all-atom RMSD cut-off of 0.7 Å. The shown structures correspond to the filled circles in (d). Cluster populations and distances between the residues are indicated. d Occupancy of the top structural clusters with respect to the applied all-atom RMSD cut-off used for clustering. The populations of the top clusters were estimated relative to the total number of configurations in joint master Tyr-Pro MD trajectories (see Methods) with a separation distance <2 nm (see (b)).

