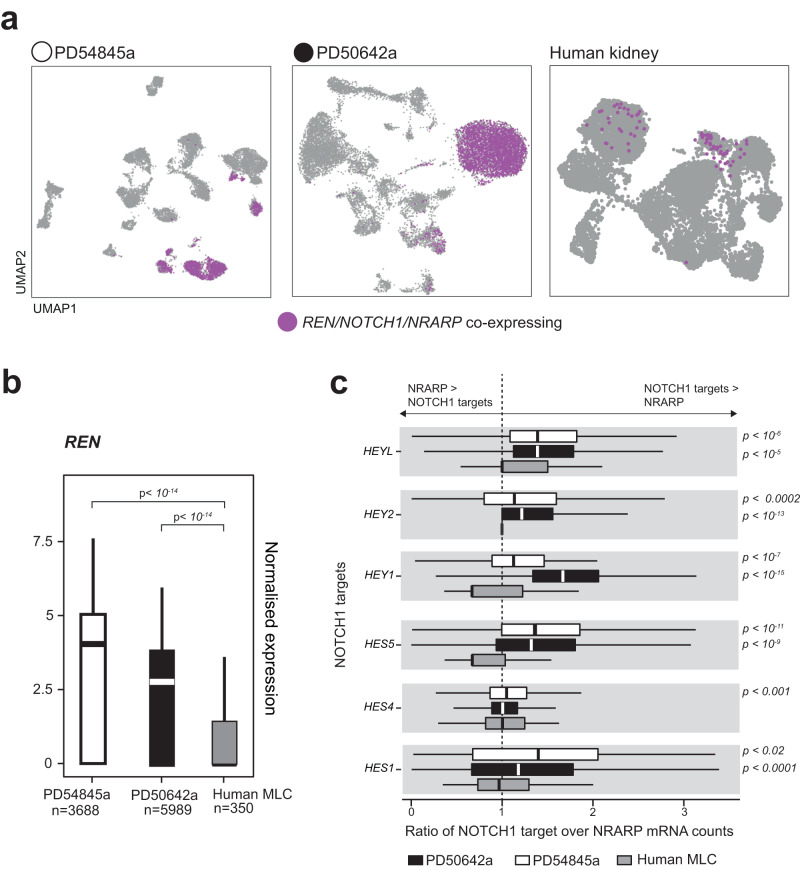
Fig. 3. Single nuclear level quantification of NOTCH1 signalling in reninomas and in mesangial-like cells.
a Uniform Manifold Approximation and Projection (UMAP) plots of tumour (left and middle panels) and healthy human kidney (right panel) cells. b Box plot quantifying renin expression in tumour cells and mesangial-like cells (MLC). The box contains the 25th to 75th percentiles of the data, with the central line denoting the median value. The upper whisker extends from the median to the largest value, no further than the 1.5 * inter-quartile range (IQR). The lower whisker extends from the median to the smallest value, at most 1.5 * IQR. Wilcoxon rank-sum test, two-sided, with adjustment for multiple comparisons. c Box plots showing the ratio of NOTCH1 target genes vs. NRARP for tumours and mesangial-like cells (MLC). The box contains the 25th to 75th percentiles of the data, with the central line denoting the median value. The upper whisker extends from the median to the largest value, no further than the 1.5 * inter-quartile range (IQR). The lower whisker extends from the median to the smallest value, at most 1.5 * IQR. Wilcoxon rank-sum test, two-sided, with adjustment for multiple comparisons. HEYL: PD50642a n = 1569, PD54845a n = 2517, MLC n = 111; HEY2: PD50642a n = 1164, PD54845a n = 2913, MLC n = 104; HEY1: PD50642a n = 185, PD54845a n = 536, MLC n = 111; HES5: PD50642a n = 706, PD54845a n = 1171, MLC n = 52; HES4: PD50642a n = 3174, PD54845a n = 5828, MLC n = 144; HES1: PD50642a n = 28, PD54845a n = 517, MLC n = 128. Source data are provided as a Source Data file.

