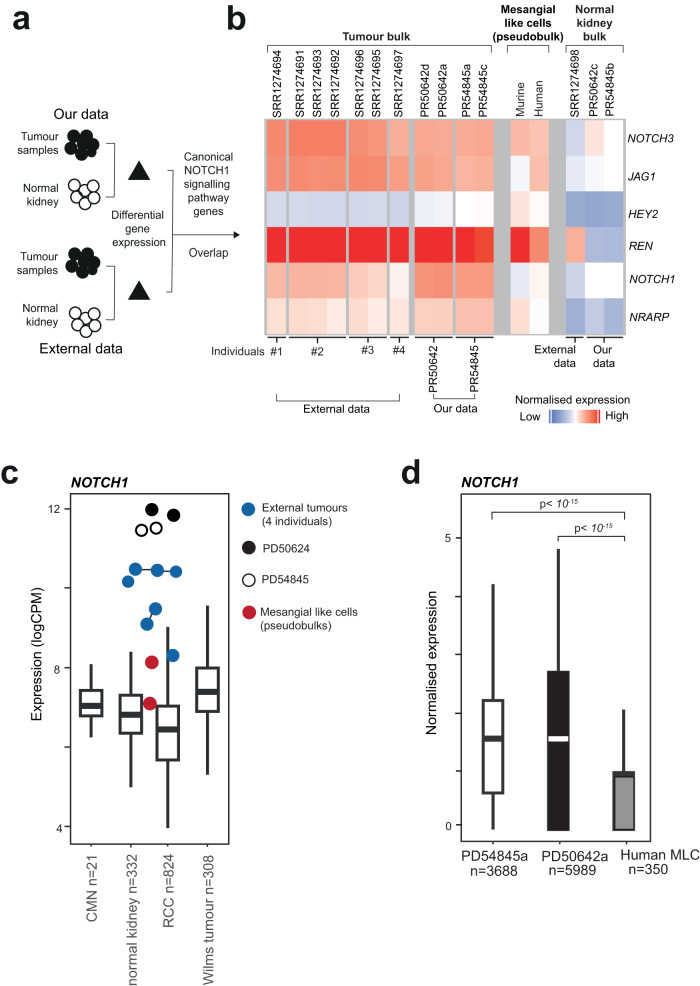
Fig. 4. Notch signalling across in-house and existing bulk reninoma transcriptomes.
a Schematic of differential gene expression analyses across different data sets. b Heatmap showing expression of Notch signalling genes and REN across reninoma, matched normal kidney, human mesangial-like cells and murine mesangial-like cells. c NOTCH1 expression (log-CPM (counts per million)) in reninomas, compared to mesangial-like cells (psuedobulks, n = 2), normal kidney (n = 332), congenital mesoblastic nephroma (CMN, n = 21), Wilms tumour (n = 308) and renal cell carcinoma (RCC, n = 824). The box contains the 25th to 75th percentiles of the data, with the central line denoting the median value. The upper whisker extends from the median to the largest value, no further than the 1.5 * inter-quartile range (IQR). The lower whisker extends from the median to the smallest value, at most 1.5 * IQR. d Box plot quantifying NOTCH1 expression in tumour cells and mesangial-like cells (MLC). The box contains the 25th to 75th percentiles of the data, with the central line denoting the median value. The upper whisker extends from the median to the largest value, no further than the 1.5 * inter-quartile range (IQR). The lower whisker extends from the median to the smallest value, at most 1.5 * IQR. Wilcoxon rank-sum test, two-sided, with adjustment for multiple comparisons. Source data are provided as a Source Data file.

