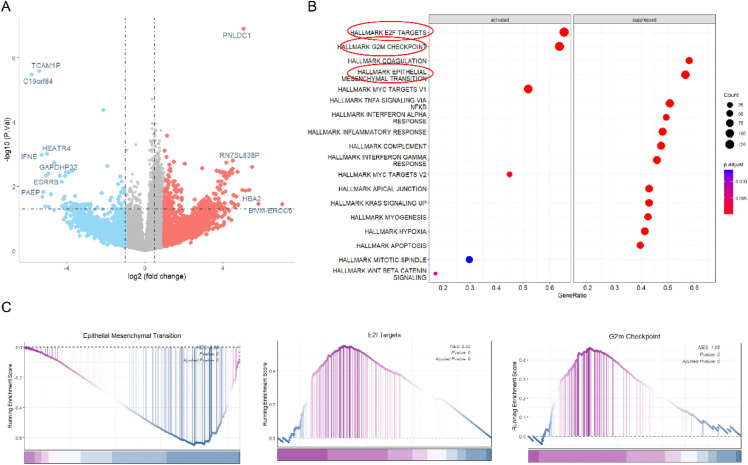
Figure 1.
RNA sequencing analyses. (A) A total of 360 DEGs were obtained between HES1 (+) group (n = 5) and HES1 (−) group (n = 5) (p < 0.05), of which 248 DEGs were downregulated and 112 DEGs were upregulated in HES1 (−) group. (B) The biological pathways implicated by the aberrant HES1 expression revealed by GSEA analysis of the DEGs of HES1 (+) and HES1 (−) groups. (C) GSEA plots showing that HES1 loss was positively correlated with “EPITHELIAL_MESENCHYMAL_TRANSITION” signaling, but negatively correlated with “E2F_TARGETS” and “G2M_CHECKPOINT” signaling.

