Figure 5.
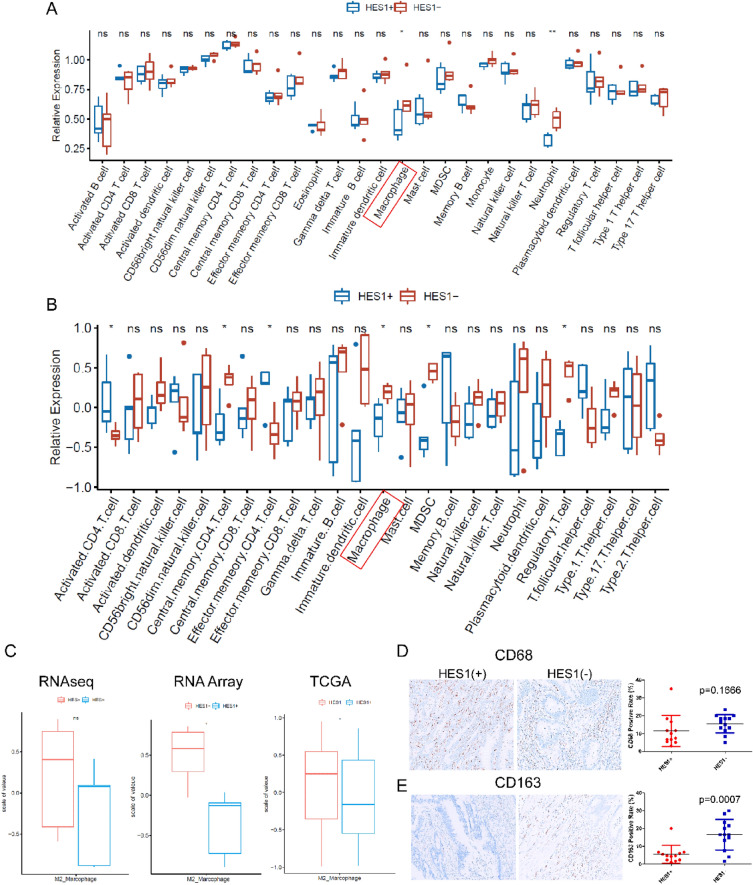
Tumor infiltrating immune cell signatures and macrophage markers in HES1 (+) and HES1 (−) CRCs. (A, B) Tumor infiltrating immune cell signature was analyzed. The signature of macrophage was elevated in HES1 (−) group from both RNA sequencing (A) and nanostring array (B) (p < 0.05). M2 macrophage were sub-clustered by the expression of CD206, CD204 and CD163. Higher M2 macrophages in HES1 (−) group were observed in RNA sequencing, nanostring array and TCGA data (*p < 0.05) (C). A pan-macrophage or M1 macrophage marker, CD68 (D), and the M2 macrophage marker, CD163 (E) was examined by IHC, both of which showed cytoplasmic staining. There was no significant difference in the density of CD68 positive macrophages between HES1 (+) and HES1 (−) groups (p = 0.1666) (D). The density of CD163 positive macrophages was much higher in HES1 (−) group (p = 0.0007) (E).

