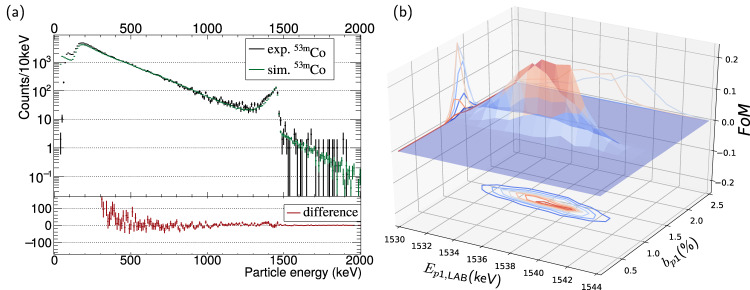
Fig. 2. Proton branching ratio, bp1, determination.
a Experimental and simulated energy spectra recorded at the TASISpec implantation detector for particles and protons, the error bars represent the standard error in the number of counts. The simulated spectrum was normalized to the experimental one in the energy range 500 keV–1000 keV. The experimental data are best described when an absolute proton branching ratio of bp1 = 1.3(1)% is used. The difference between the experimental and simulated spectra can be seen at the bottom. b Result of the Figure-of-Merit (FoM) from a minimization algorithm between experimental and simulated results.

