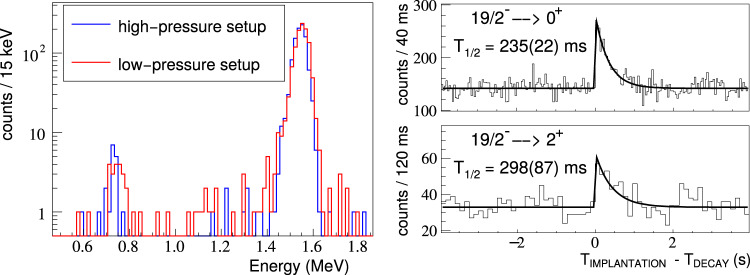
Fig. 3. Experimental proton energy and half-life measurement using ACTAR TPC.
Left: Proton energy spectra associated with the decay of 53mCo for the two different pressure settings (380 and 292 mbar). Right: Half-life spectra obtained by correlating the proton emission, identified by their characteristic energy-loss profile, with 53mCo implantation for both pressure regimes. The line represents a least-squares fit of an exponential decay to the data.

