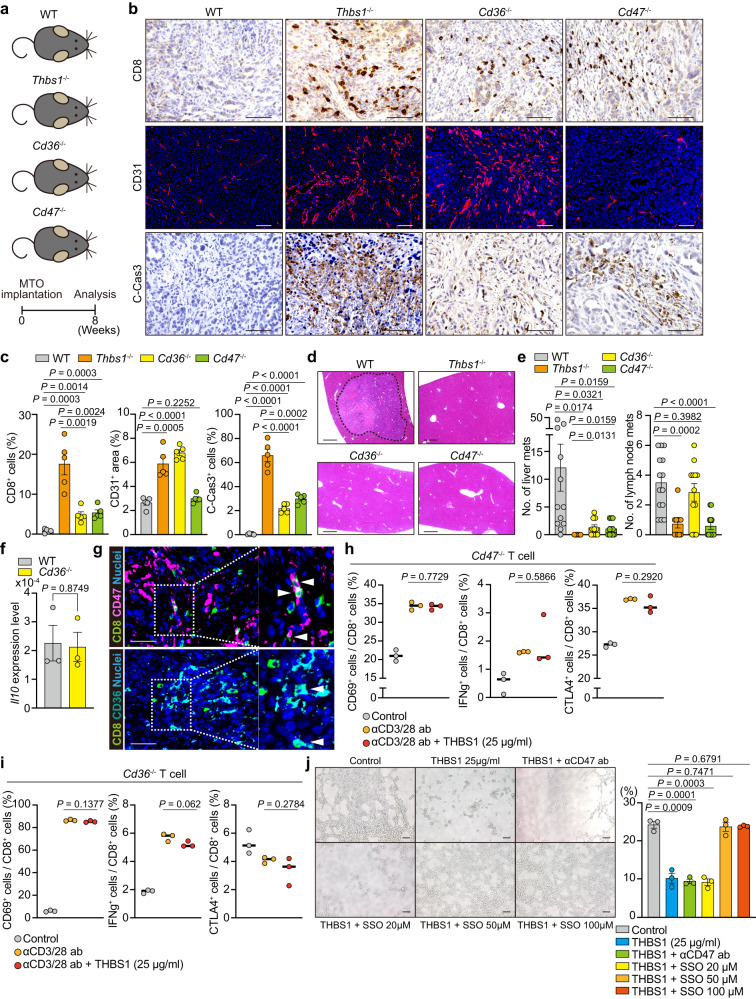
Fig. 4. THBS1 enhances metastases through the interaction with both CD47 and CD36.
a Schematic representation of orthotopic implantation of MTO in the mice with indicated genotypes (n: WT = 14, Thbs1-/- = 11, CD36-/- = 12, CD47-/- = 12). b–d Immunostaining b and quantification of b (c; n = 5 mice per group) of the primary tumors and H&E staining d of liver of a. Dash lines denote liver metastases. e Macroscopic quantification of the numbers of liver and lymph node metastases in a (n = mice, per genotype: WT = 14, Thbs1-/- = 11, CD36-/- = 12, CD47-/- = 12). f qRT-PCR analysis in the orthotopic MTO tumors in WT and Cd36-/- mice (n = 3 mice per group). g Co-immunostaining for CD8 and CD47 (top) or CD36 (bottom) in primary lesions of MTO-bearing WT mice (n = 3 mice). White arrowheads denote co-stained cells. h, i FACS analyses of indicated cell proportions in CD8+ (CD3+CD8+) T cells sorted from CD47-/- h or CD36-/- i mice. Individual plots indicate the biological replicates of isolated CD8+ (CD3+CD8+) CD47-/- T cells or CD36-/- T cells (n = 3 per group) treated with or without anti-CD3/CD28 antibodies. j Representative images of tube formation assay of C166 cells in the presence or absence of recombinant THBS1 (25 μg/ml) or presence of THBS1 combined with anti-CD47 antibody (αCD47ab) or sulfosuccinimidyl oleate (SSO) at indicated concentration, and quantification of tube area (n = 3 biologically independent samples). Scale bars, 50 μm b, g, 100 μm j, 200 μm d. Mean ± SEM. P values were calculated by two-tailed, unpaired Student’s t test. Source data are provided as a Source Data file.

