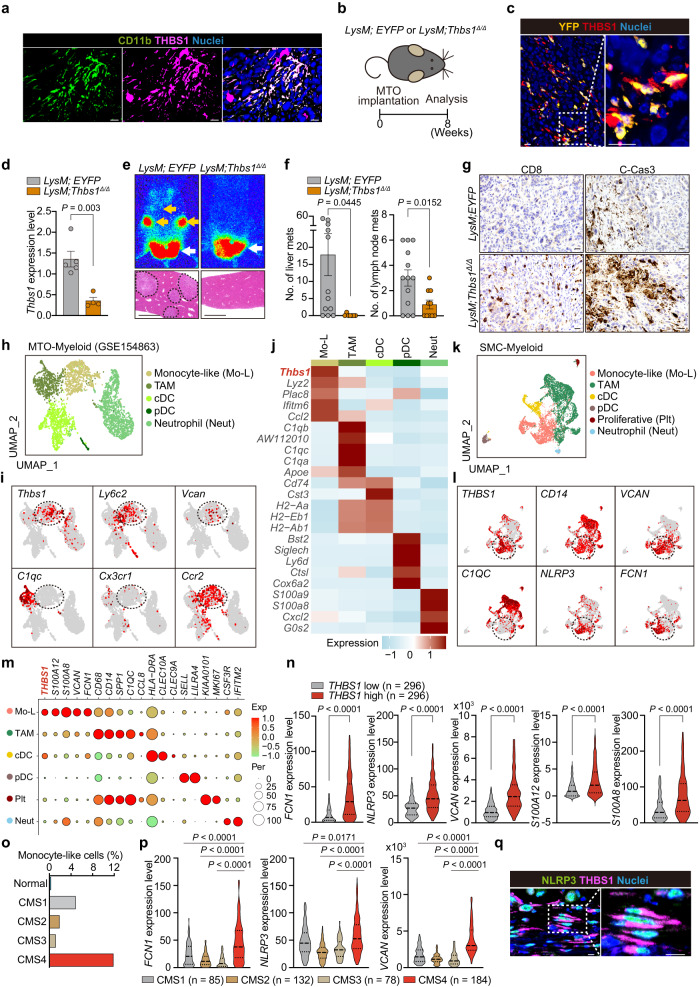
Fig. 5. Monocyte-like cells are the primary source of THBS1.
a Co-immunostaining of the orthotopic MTO tumors in WT mice (n = 3 mice). b Schematic representation of orthotopic implantation of MTO to the mice with indicated genotypes. c Co-immunostaining in the MTO tumors in LysM;EYFP mice (n = 3 mice). d qRT-PCR analysis in the orthotopic MTO tumors in LysM;EYFP (n = 5 mice) and LysM;Thbs1Δ/Δ mice (n = 4 mice). e Bioluminescence imaging (top) and H&E of liver (bottom) of b. f Macroscopic numbers of metastases in liver (n = mice per group: LysM;EYFP = 12, LysM;Thbs1Δ/Δ = 7) and lymph node (n = mice per group: LysM;EYFP = 13, LysM;Thbs1Δ/Δ = 10) of b. g Immunostaining in the orthotopic MTO tumors of b (n = 5 mice). h–j UMAP plot h of murine myeloid clusters, and UMAP plots i and heatmap j of representative genes for each cluster of (h) in scRNAseq data of orthotopic MTO tumors (GSE154863). Dash lines denote monocyte-like cluster. k–m UMAP plot k of human myeloid clusters and UMAP plots l and dot plots m of representative genes for each cluster of k in SMC dataset (GSE132465). Dash lines denote monocyte-like cluster. n Transcript levels of indicated genes in TCGA (n = 296). o Proportions of monocyte-like cells in myeloid cellular compartment of SMC, stratified by CMS subtypes. p Violin plots for indicated genes in TCGA, stratified by CMS subtypes (n: CMS1 = 85, CNS2 = 132, CMS3 = 78, CMS4 = 184). q Co-immunostaining in human CRC (n = 3 samples). Arrows in e: primary lesion (white), distant metastases (yellow). Dash lines denote liver metastases in e. Scale bars, 10 μm (a, c, g, q), 500 μm e. Immunostaining experiments (a, c, g, q) were independently repeated at least three times, yielding similar results. P values were calculated by two-tailed, unpaired Student’s t test in d, f, or two-tailed Mann–Whitney test n, p. Source data are provided as a Source Data file.

