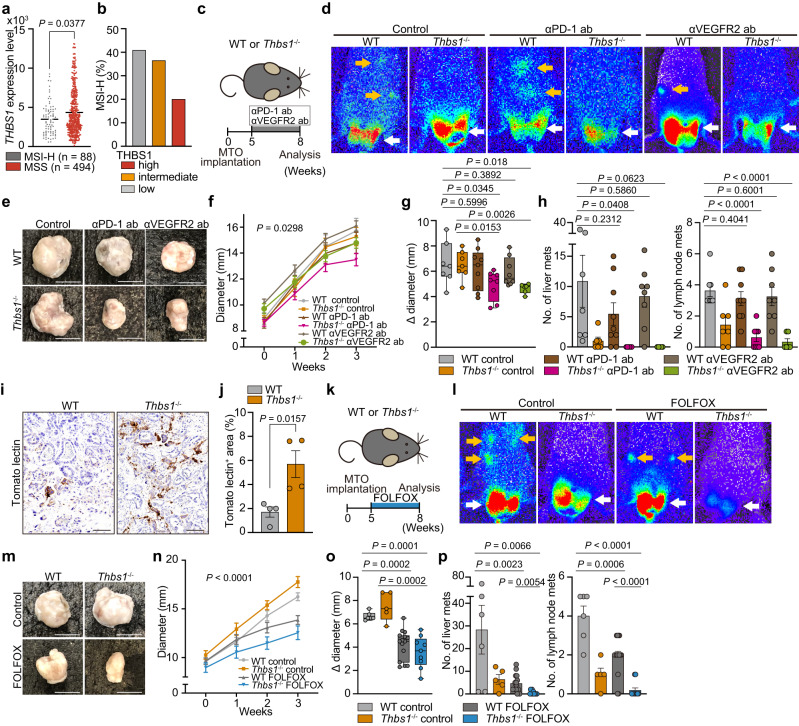
Fig. 7. Inhibition of THBS1 partially improved response of aggressive CRC to current treatments.
a THBS1 expression in MSI-H or MSS CRC from TCGA. b Proportion of MSI-H CRC in TMA samples, stratified by THBS1 expression intensity (n: high = 100, intermediate = 115, low = 93). c–h Treatment experiment with anti-PD-1 antibody (αPD-1 ab) or anti-VEGFR2 antibody (αVEGFR2 ab) on MTO-bearing WT or Thbs1-/- mice (n: WT control = 8, THBS1-/- control = 7, WT with αPD-1 ab = 9, Thbs1-/- with αPD-1 ab = 8, WT with αVEGFR2 ab = 8, Thbs1-/- with αVEGFR2 ab = 6). Schematic representation c, and bioluminescence imaging d. Macroscopic images e, growth kinetics f, and the change in diameter g of primary tumors in indicated groups. Macroscopic numbers of liver and lymph node metastases h. i, j Tomato lectin staining (i) in the orthotopic MTO tumors in WT (n = 5) or Thbs1-/- mice (n = 4) and quantification j. k–p, Treatment experiment with FOLFOX on MTO-bearing WT or Thbs1-/- mice (n = mice per group: WT control = 6, THBS1-/- control = 5, WT with FOLFOX = 15, Thbs1-/- with FOLFOX = 9). Schematic representation k and bioluminescence imaging l. Macroscopic images m, growth kinetics n, and the change in diameter o of primary tumors in indicated groups. Macroscopic numbers of liver and lymph node metastases p. Arrows in d, l: primary lesions (white), distant metastases (yellow). Scale bars: 50 μm in i, 1 cm (rest). Mean ± SEM. The whiskers show smallest and largest values and the box extends from the 25th to 75th percentiles, and the line of the middle of the box is plotted at the median in Box and whiskers plot g, o. P values are calculated by two tailed, unpaired Student’s t test g, h, j, o, p, two tailed, Mann–Whitney test a, or two-way ANOVA f, n. Source data are provided as a Source Data file.

