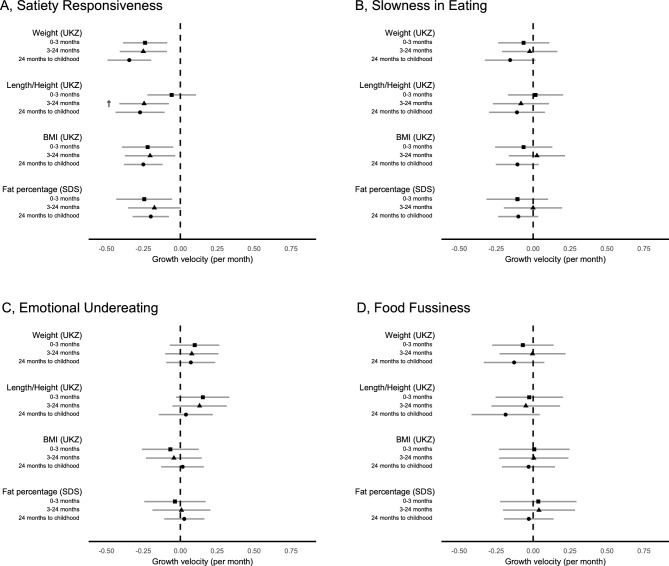
Figure 3.
Associations between the food-avoidant appetitive traits (A, satiety responsiveness; B, slowness in eating; C, emotional undereating; D, food fussiness) and individual-level growth velocities (UK z-score change/month for 1-unit increase in Likert scale) for weight, length/height, BMI, and (standard deviations of) body fat percentage. All models were adjusted for sex, age at the questionnaire completion, and birth measurements (weight, length/height, BMI, or body fat percentage). Error bars display the 95% confidence intervals of each estimate. †Associations with growth velocities at 0–3 months, 3–24 months, and 24 months to childhood (5 to 11 years) were statistically heterogenous (Wald test P < 0.05). UKZ, UK z-score; SDS, standard deviation score.

