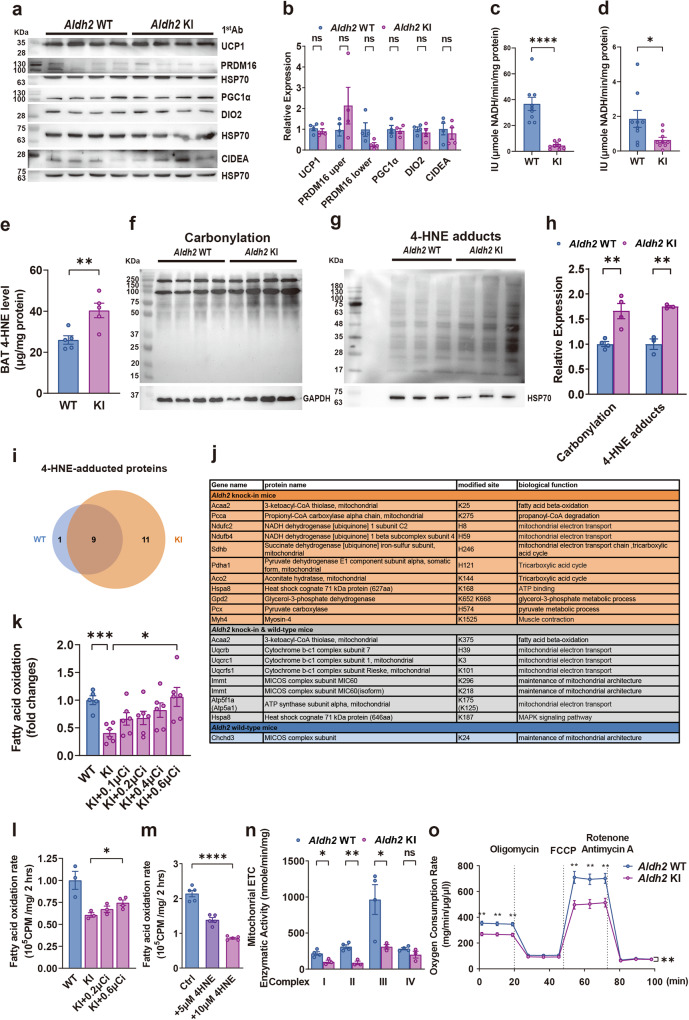
Fig. 3. Aldh2 (acetaldehyde dehydrogenase 2) knock-in mice displayed impaired decreased fatty acid oxidation rate and mitochondrial respiration of brown adipose tissue due to increased 4-hydroxynonenal-adducted proteins.
a Immunoblots and densitometry histogram showing expression of Ucp, Prdm16, Cidea, Dio2 levels (n = 4:4) and b densitometric histogram of brown adipose tissue (BAT) from Aldh2 (wild-type) WT and (knock-in) KI mice (P = 0.42, 0.25, 0.07, 0.74, 0.50, and 0.61 respectively). c ALDH2 enzymatic activity of recombinant WT and KI ALDH2 protein (n = 6:6 in duplicates; P < 0.0001) and d BAT from Aldh2 WT and KI mice (n = 9:8; P = 0.29). e 4-HNE (4-hydroxynonenal) concentration of BAT isolated from of the Aldh2 WT and KI mice (n = 5:5; P = 0.008). f Protein carbonylation of BAT mitochondria by hydrazide biotin staining (n = 4:4) and g immunoblots and densitometry histogram of 4-HNE-adducted mitochondrial proteins in the BAT from the Aldh2 WT and KI mice (n = 3:3). h densitometric histogram of f and; P = 0.006 and 0.0022 respectively) (g). i, j 4-HNE-adducted mitochondrial proteins and amino acid residues of the BAT from the Aldh2 KI and WT mice, as identified by liquid-chromatography tandem mass spectrometry (LC-MS/MS) (n = 2:2). k Fatty acid oxidation (FAO) rate of the whole BAT tissue isolated from the Aldh2 WT and KI mice rescued with 0.1. 0.2 and 0.4 μCi3H-palmitate respectively (n = 5:7:7:7:7; P = 0.0003 and 0.0011). l FAO of primary brown adipocytes isolated from the Aldh2 WT and KI mice rescued with 0.2 and 0.6 μCi 3H-palmitate respectively (n = 3:3:3:4; P = 0.016). m FAO rate of induced primary brown adipocytes isolated from the WT mice treated with 0, 5, and 10 μM 4-HNE (n = 3:3; P < 0.0001) rescued with plamitate. n Mitochondrial electron transfer chain (ETC) complex I-IV enzymatic activity isolated from the BAT of Aldh2 WT and KI mice on HFHSD (n = 4:4; P = 0.019, 0.0018, 0.044, and 0.11 respectively). o Oxygen consumption rate (OCR) of induced primary brown adipocytes isolated from Aldh2 WT and KI mice fed on high-fat high-sucrose diet. Cells were treated with oligomycin, FCCP (carbonyl cyanide p-trifluoro methoxyphenylhydrazone), and Rotenone/Antimycin A.OCR measurements were normalized to the protein concentration. (n = 3 per group; repeated measures analysis of variance (ANOVA) P = 0.0026). Figures (k–m) were analyzed using tests for linear trend. Figures (b–e, h, k, n, o) were analyzed using two-sample independent t-tests. Figure (o) was analyzed using repeated measures ANOVA. All data are presented as mean and standard error (S.E.M.). The n values represent biological repeats and the number of technical repeats are expressed as duplicates or triplicates. The asterisks indicate two-sided *P < 0.05, **P < 0.01, ***P < 0.001, ****P < 0.0001.

