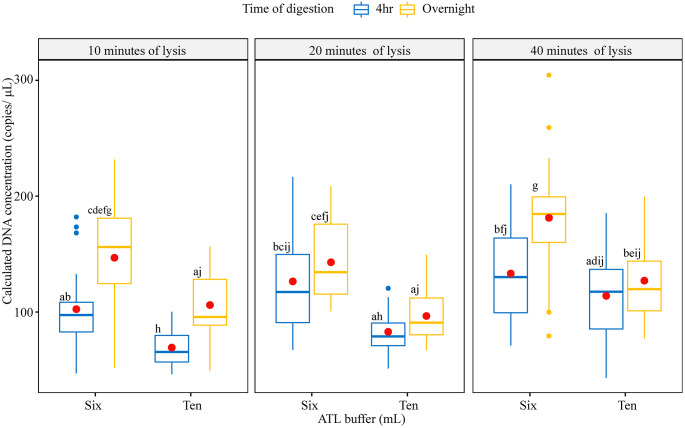
Fig. 1.
Khapra beetle (Trogoderma granarium) DNA extracted from wheat germ trap with various DNA extraction protocols. In the box plots, the boundaries of the box indicate the 25th and 75th percentiles, a thick line within the box marks the median and a red dot within the box marks the mean. Whiskers above and below the box indicate the 10th and 90th percentiles. Points above and below the whiskers indicate outliers outside the 10th and 90th percentiles. There was no significant difference among means sharing the same letter according to Tukey post-hoc tests (P < 0.05)

