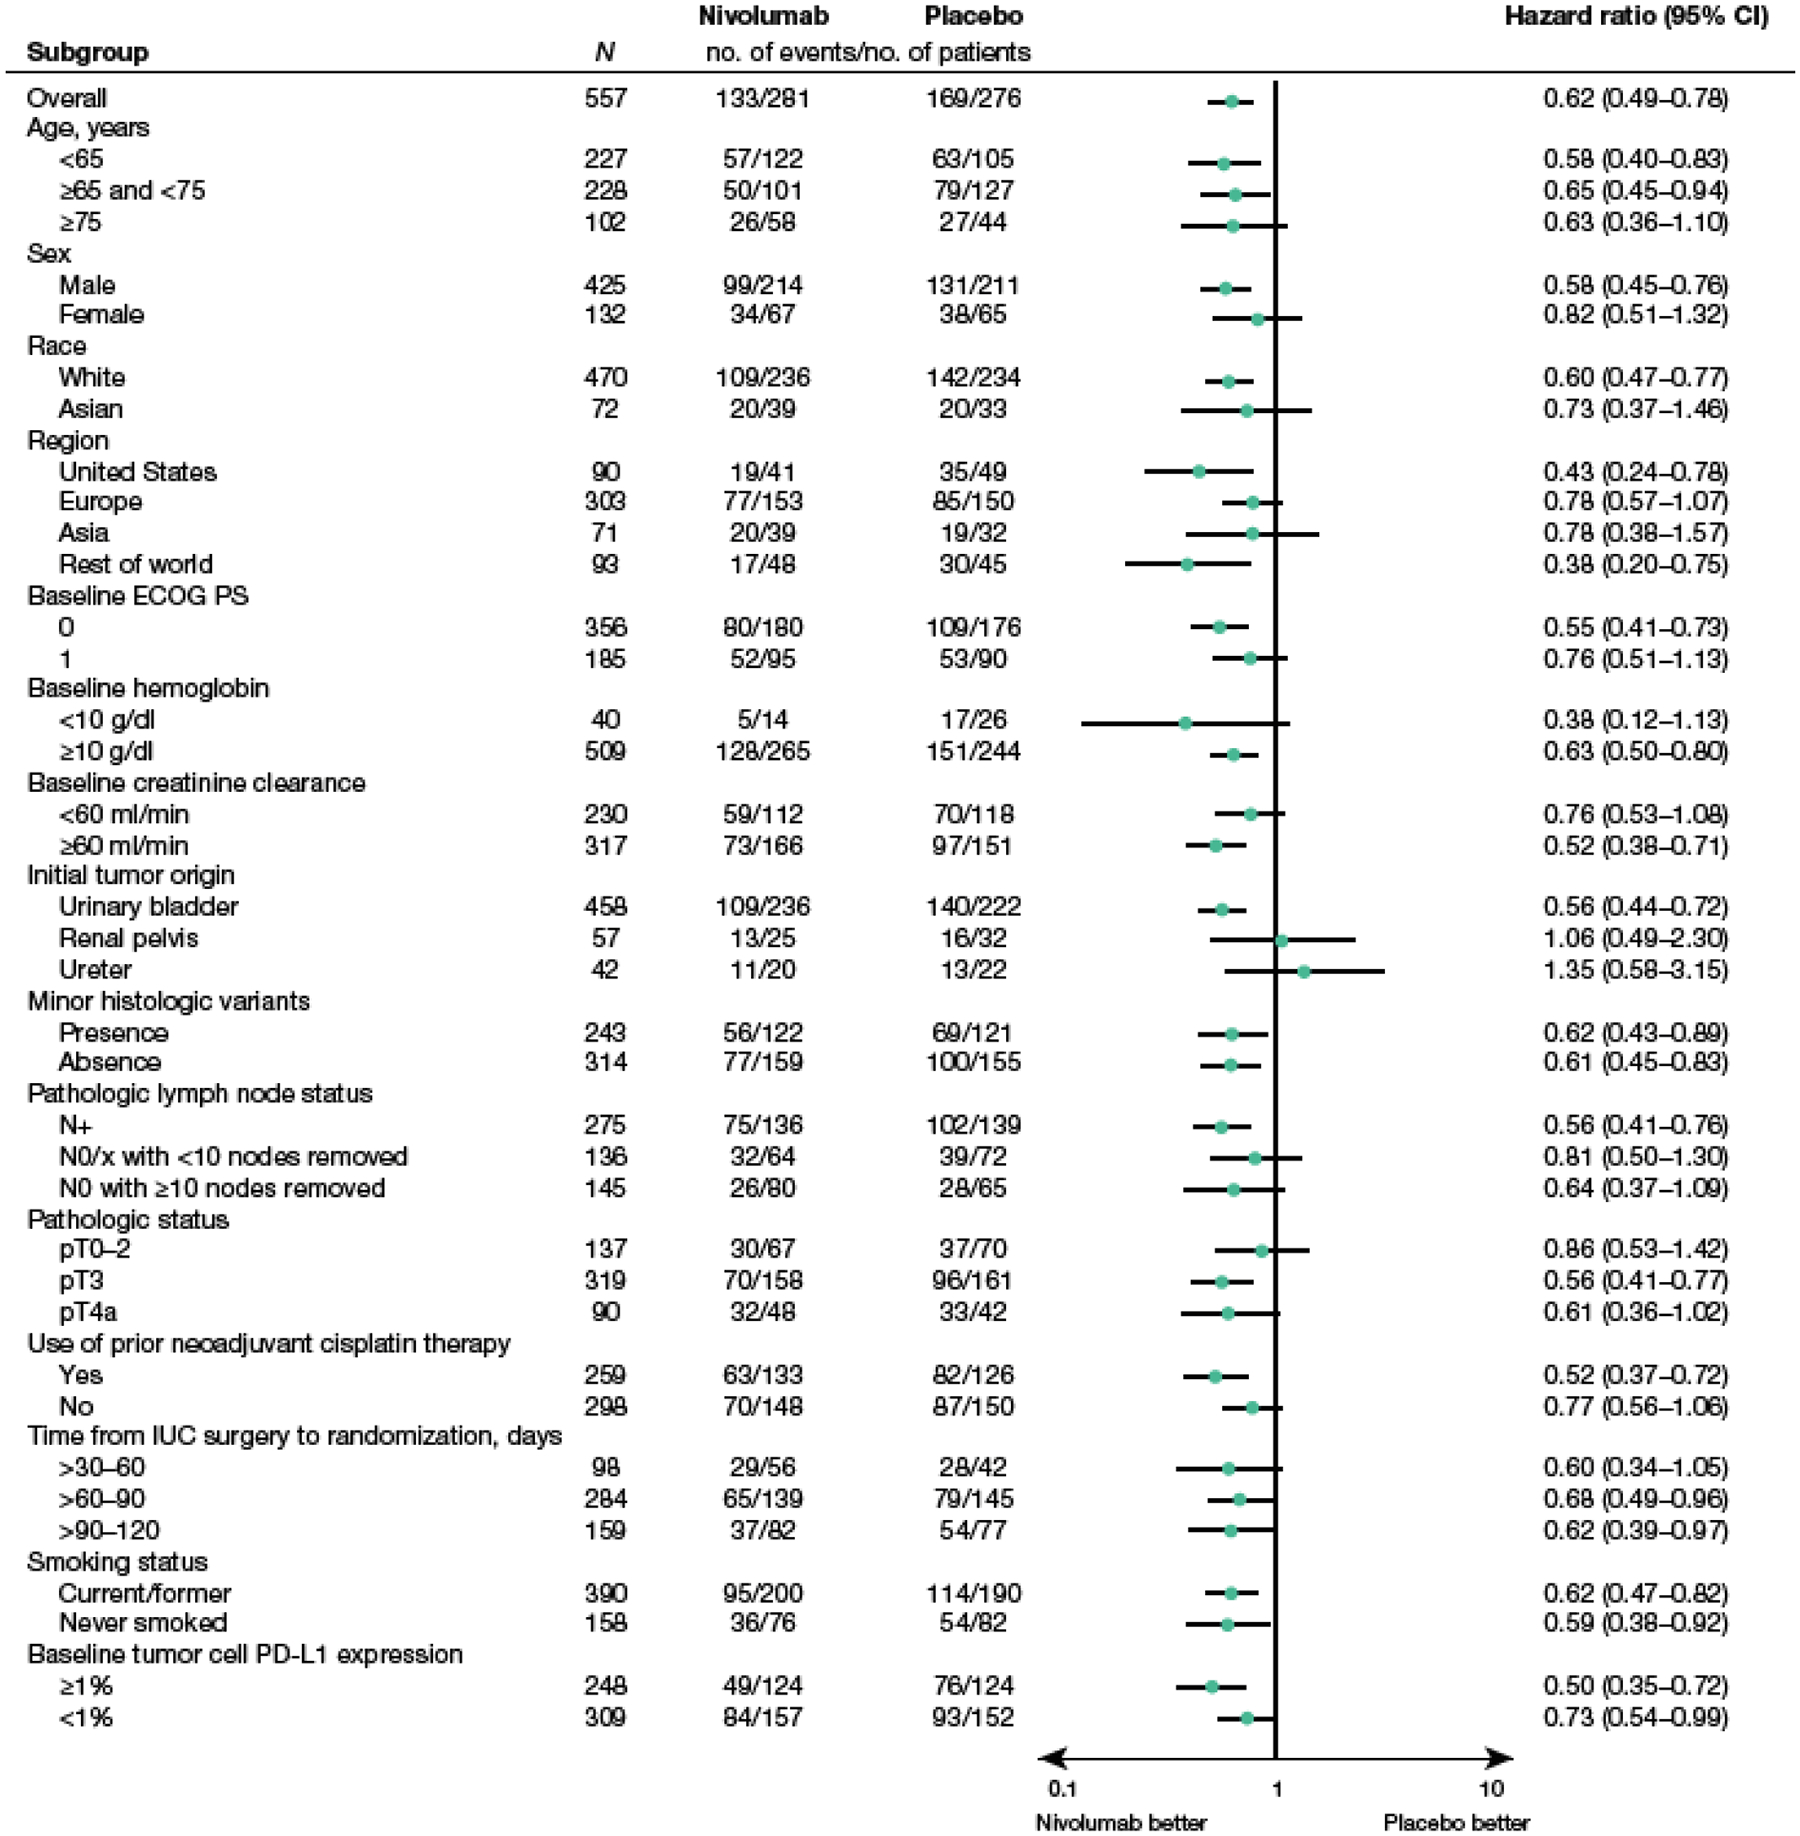
Fig. 4 –

Forest plot of DFS by clinical and demographic subgroup in patients with CPS ≥1 (among all randomized patients with quantifiable CPS and TC at baseline).
Median DFS is based on Kaplan–Meier estimates. Hazard ratio calculated with stratified Cox proportional hazard model.
Hazard ratio is not computed for subset (except age, region, and sex) category with less than 10 patients per treatment group.
CPS, combined positive score; DFS, disease-free survival; ECOG PS, Eastern Cooperative Oncology Group performance status; IUC, invasive urothelial carcinoma; N, node; P, pathologic; PD-L1, programmed death ligand 1; T, tumor; TC, tumor cell score; X, cannot be assessed
