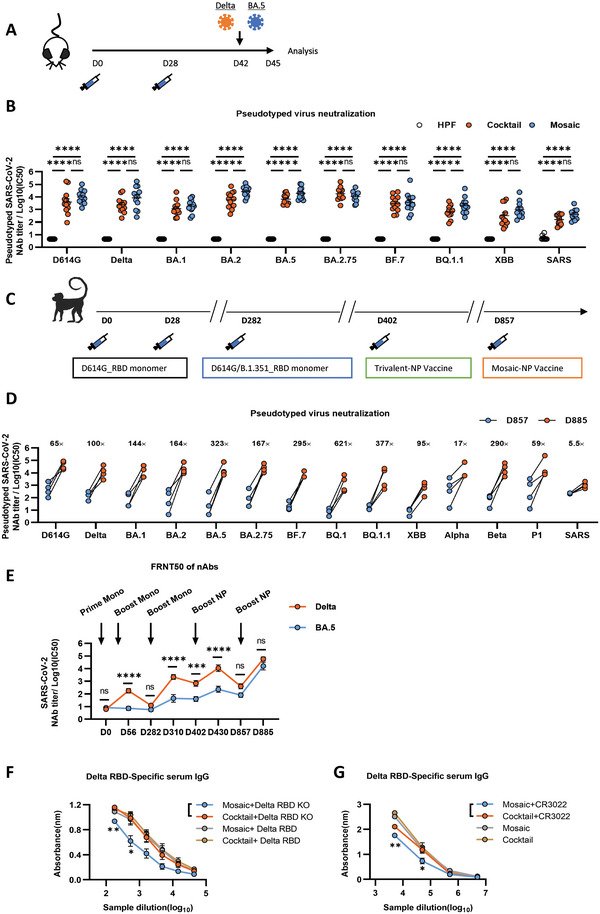
Figure 2.

The immunization effectiveness of the mosaic RBD nanoparticle vaccines. A) Immunization schedule. K18‐hACE2 mice were immunized with either 10 µg mosaic RBD NP vaccine, cocktail NP vaccine, or the molar equivalent of Sd‐HPF NP through the subcutaneous route at days 0 and 28. Mice were challenged with authentic SARS‐CoV‐2 (Delta/BA.5) on day 42 and euthanized three days post‐challenge for analysis. B) Pseudovirus neutralization Ab titers of sera from K18‐hACE2 mice immunized with cocktail and mosaic RBD nanoparticles at week 6 against SARS and a panel of nine SARS‐CoV‐2 mutant variants (n = 12). C) Immunization schedule. Rhesus Macaques were primed and boosted with D614G_RBD monomer intramuscularly vaccinated at days 0 and 28. On day 282, Rhesus Macaques was vaccinated with the third dose of D614G/B.1.351_RBD monomer. On day 402. the fourth dose of the trivalent RBD‐NP vaccine, which includes the D614G, B.1.351, and Delta individual RBD NPs, was given an intramuscular injection. On day 857, the Rhesus Macaques were immunized with mosaic RBD NP. D) The NAbs titer for pandemic and potential pre‐emergent SARS‐CoV‐2 virus of Rhesus Macaques before and post the boost of mosaic RBD NP vaccine was determined by pseudotyped virus neutralization assay and represented as IC50. Each dot represents serum from one animal (n = 4). The fold changes were calculated by comparing the mean value of each group. E) Each Rhesus Macaque serum nAbs titer against authentic Delta and BA.5 variants virus on different days was evaluated using FRNT50. FRNT50 of nAbs of authentic Delta and BA.5 variants were determined by FRNT and plotted as a time‐course curve. F) The binding affinity of nanoparticle‐vaccinated mice serum with Delta RBD or Delta RBD‐KO was analyzed by ELISA. G) Antibody competition experiments of nanoparticle immunized mouse serum with CR3022 were analyzed by ELISA. OD values versus dilution factors are plotted. Experiments were conducted independently in triplicates. Data are represented as mean ± SEM. Adjusted p‐values were calculated by one‐way ANOVA with Tukey's multiple comparison test. Asterisks indicate significant differences between groups linked by horizontal lines. *p ≤ 0.05, **p ≤ 0.01, ***p ≤ 0.001, ****p ≤ 0.0001, ns = not significant.
