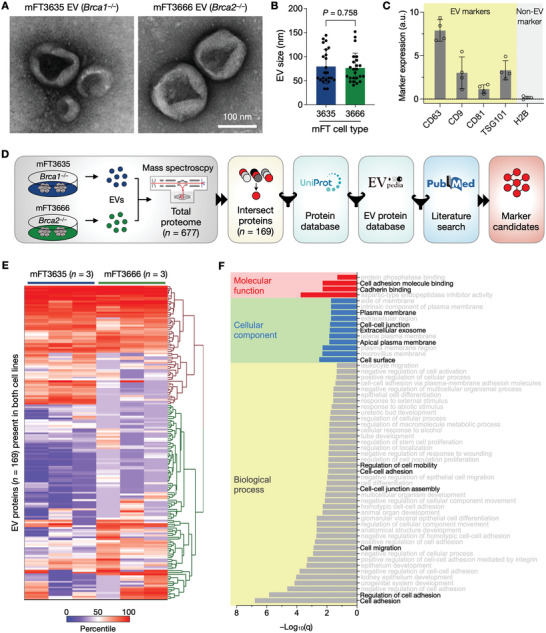
Figure 3.

mFT‐EV marker selection. A) EVs from oncogenic mFT cells were imaged via transmission electron microscopy (TEM). B) Size distribution of EVs in TEM images. No significant difference (P = 0.758, unpaired two‐sided t‐test) was observed. Each dot represents a single EV. Error bars, s.d. C) Bulk EV analysis confirmed that mFT EVs were enriched with canonical EV markers (i.e., CD63, CD9, CD81, TSG101) and devoid of a non‐EV marker (histone H2B), a.u., arbitrary units. Data are displayed as mean ± s.d. (n = 4). D) Marker selection algorithm. EVs from mFT3635 and mFT3666 cells were processed for proteomic analysis. Detected proteins were filtered for their location in the cell membrane (Uniprot) and presence in EVs (EVpedia), and the outcomes were further curated through a literature search (PubMed). E) Heatmap of proteins (n = 169) found in EVs from mFT3635 and mFT3666 cell lines. The data‐driven approach selected nine candidate markers (PODXL, JUP, TNC, VCAN, CD24, EpCAM, HE4, FOLR1, and CA125). F) Gene ontology (GO) analysis showed that the selected markers were strongly associated with cellular adhesion. GO analysis was performed with STRING v11.5.
