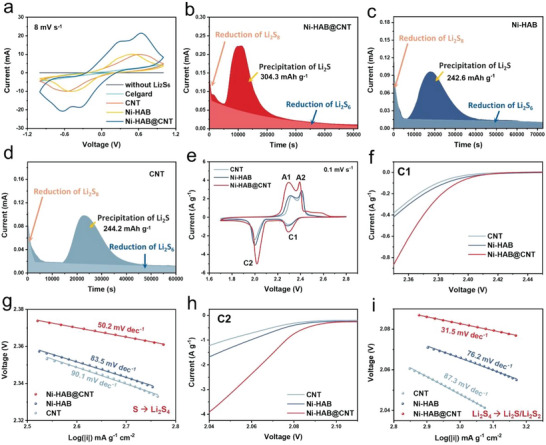
Figure 5.

a) CV curves of Li2S6 symmetric cells with different electrodes; b–d) potentiostatic discharge plots of different cells at 2.05 V; e) CV profiles of Li‐S cells with different separators at a scan rate of 0.1 mV s−1; f) the enlarged cathodic peak in the range of 2.35–2.45 V and g) corresponding Tafel profiles; h) the enlarged cathodic peak in the range of 2.04–2.11 V and i) corresponding Tafel profiles.
