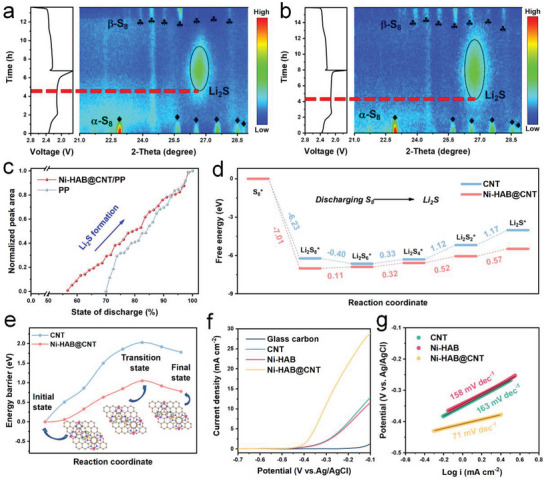
Figure 6.

In situ XRD characterization in contour plots of the Li‐S cells and corresponding charge–discharge profiles (left) a) without and b) with Ni‐HAB@CNT modified layer during the initial cycle at the current rate of 0.1 C; c) the peak area quantified evolution of crystalline Li2S phase as a function of discharge states; d) Gibbs free energy profiles for the discharging process on Ni‐HAB@CNT and CNT; e) decomposition energy barriers for Li2S → LiS + Li on Ni‐HAB@CNT and CNT for different adsorbate configurations (insets: the initial, transition, and final state structures); f) LSV curves and g) the corresponding Tafel plots of Li2S oxidation with different electrodes at 5 mV s−1.
