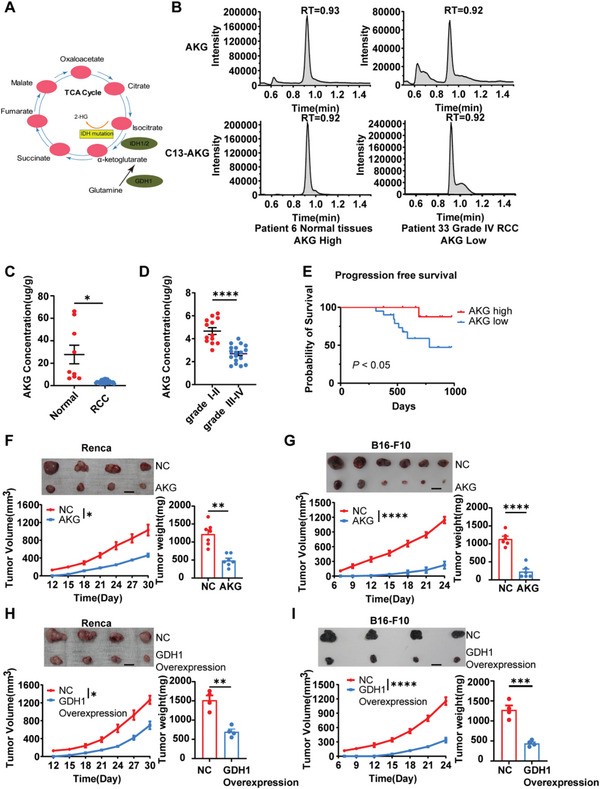
Figure 1.

AKG attenuates Renal Cell Carcinoma development. A) The metabolic map of the α‐ketoglutarate metabolism pathway. B) Representative concentration of tumor αKG and C13‐αKG of two independent RCC patients. C) Quantification of αKG concentration in adjacent normal tissues (n = 9) and tumor tissues (n = 31) in RCC patients. Patients diagnosed with clear cell renal cell carcinoma were included (4 cm < mass diameter < 7 cm). D) Quantification of αKG concentration in tumor tissues of Grade I‐II (n = 13) and Grade III‐IV (n = 18) RCC patients. E) Progression‐free survival curves among patients with high concentration (no less than 4 µg g−1) and low concentration (< 4 µg g−1) αKG. p < 0.050. F) Average tumor growth and weight of Renca (n = 7) and G) B16‐F10 (n = 6) tumor‐bearing mice pre‐treated with/without 5 mm αKG for 4 days. H) Average tumor growth and weight of Renca (n = 4) and I) B16‐F10 (n = 4) tumor‐bearing mice transfected with vehicle (NC) or GDH1‐Overexpression plasmids. Data are mean ± S.E.M.; log‐rank (Mantel‐Cox) test was used for (E). Two‐tailed unpaired Student t‐test was used for (C,D) and (F–I). *p < 0.05, **p < 0.01, ***p < 0.001, and ****p < 0.0001. Scale bars represent 1 cm for (F–I).
