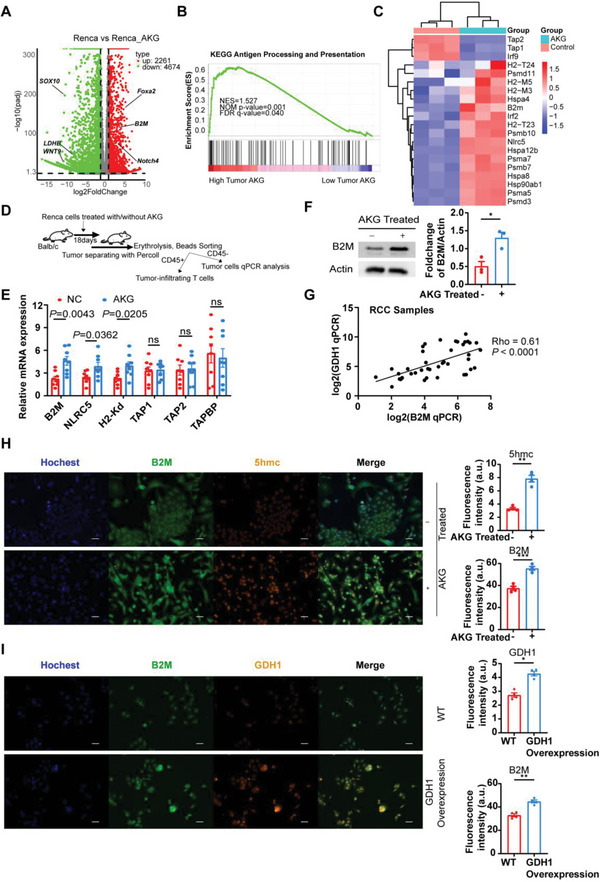
Figure 2.

AKG promotes the expression of B2M in RCC tumors. A) Volcano plots showing DEGs of Renca cells (Fold change >1.5) between the αKG group and control group. B) GSEA enrichment results indicate the pathway enriched in the αKG high group. C) Heatmaps illustrate the expression of genes associated with antigen presentation and processing pathways between the αKG group and the control group. D) Schematic of experimental design for experiments shown in (E). E) qPCR analysis indicates the mRNA expression levels of common molecules (B2M, NLRC5, H2‐Kd, TAP1, TAP2, TAPBP) associated with antigen presentation and processing pathways in Renca tumors between the αKG group and control group in vivo (n = 8). F) Representative and statistical western blot results (n = 3, in triplicate and repeated 3 times independently) show the protein levels of B2M of Renca cells between the αKG group and control group in vitro. G) Correlation of B2M and GDH1 mRNA expression in RCC clinical samples (n = 42). Statistical significance was determined by the Pearson correlation test. H) Representative and statistical analysis (n = 4, repeated 4 times independently) of the immunofluorescent staining results of nuclear (blue), B2M (green), 5hmc (red, localized in cellular nuclei), and merged files of Renca cells between the αKG group and control group. I) Representative and statistical analysis (n = 4, repeated 4 times independently) of the immunofluorescent staining results of nuclear (blue), B2M (green), GDH1 (red), and merged files of Renca cells between the GDH1‐Overexpression group and WT group. Error bar represents mean ± SEM. Statistical significance was determined by unpaired Student's t‐test for (E,F) and (H,I). ns = no significant, *p < 0.05, **p < 0.01, ***p < 0.001, and ****p < 0.0001. Scale bars represent 30 um for (H,I).
