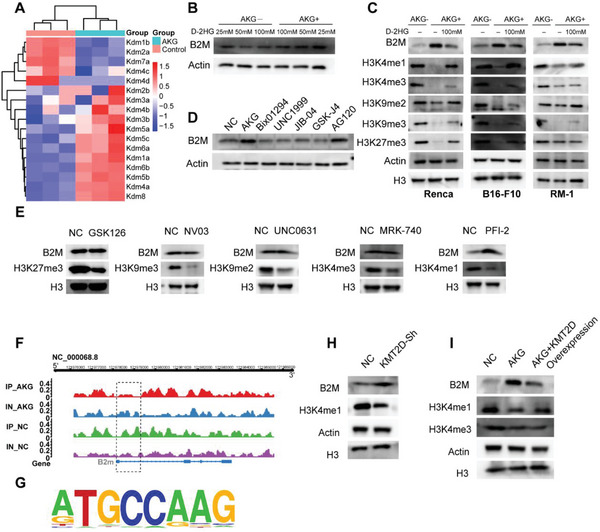
Figure 4.

AKG upregulates B2M expression by debilitating enrichment of H3K4me1 in the promoter regions. A) Heatmaps illustrate the expression of genes in the αKG‐dependent histone demethylase family. B) Western results show B2M expression under the concentration of 25, 50, and 100 mm D‐2HG treatment treated with/without 5 mm αKG. C) Western results show B2M, H3K4me1, H3K4me3, H3K9me2, H3K9me3, and H3K27me3 in 3 different murine tumor cell lines: Renca, B16‐F10, and RM‐1 treated with/without 5 mm αKG and 100 mm D‐2HG. β‐actin and H3 were used as the reference protein. D)Western results show B2M expression in Renca cells treated with αKG, Bix01294, UNC1999, JIB‐04, GSK‐J4, and AG120. E) Western results show B2M and H3K4me1, H3K4me3, H3K9me2, H3K9me3, and H3K27me3 expression in Renca cells treated with GSK126, NV03, UNC0631, MRK‐740, and PFI‐2. F) Chip‐seq results show the H3K4me1 enrichment in the promoter region of B2M in Renca cells treated with/without αKG. IP‐AKG/NC: Chip‐seq pulled by H3K4me1 in the AKG/NC group; IN‐AKG/NC: Chip‐seq pulled by IgG in the AKG/NC group; G) Top consensus motif identified by HOMER with H3k4me1 peaks in (F). p‐Value = 1e‐39. H,I) B2M expression and H3K4me1 levels in Renca treated as indicated.
