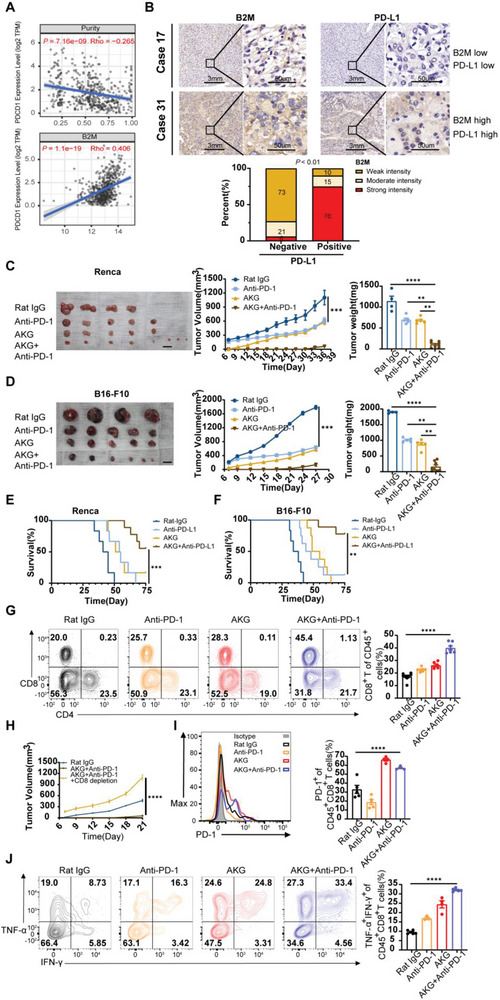
Figure 7.

AKG potentiated anti‐PD1 immune checkpoint therapeutic efficacy. A) Correlation of B2M expression with tumor purity and PD‐1 expression of tumor‐infiltrating immune cells obtained from TIMER (purity‐corrected Spearman test). B) Top: IHC staining of B2M (left) and PD‐L1(right) in KIRC tumors collected by us was performed. Bottom: Quantitative IHC analysis of correlation of B2M expression (n = 65) and PD‐L1 expression (n = 50). C) Average tumor volumes and weight of Renca tumor‐bearing Balb/c mice and B16‐F10 tumor‐bearing C57 mice D) treated with Rat‐IgG (n = 4), αKG (n = 6), or anti‐PD‐1(n = 5) monotherapy and combination therapy (n = 8 in the Renca murine model and n = 6 in the B16‐F10 murine model). E) Survival curves of Renca tumor‐bearing Balb/c mice and F) B16‐F10 tumor‐bearing C57 mice treated as indicated. Renca model: Rat IgG group (n = 6), αKG group (n = 6), PD‐1 group (n = 6), and combination group (n = 9); B16‐F10 model: Rat IgG group (n = 6), αKG group (n = 8), PD‐1 group (n = 8), and combination group (n = 9). G) Representative flow plots and quantification of tumor‐infiltrating CD4+ and CD8+ T cells in Renca tumors and B16‐F10 tumors treated as indicated (n = 4). H) Average tumor growth of B16‐F10 tumor‐bearing animals treated with Rat IgG, combination therapy, and α‐CD8 depleting antibody. I) Representative flow plots and quantification of PD‐1 expression on the intra‐tumoral CD8+ T cells from B16‐F10 tumor‐bearing mice treated as indicated (n = 8 for Rat IgG group, n = 6 for αKG group, n = 6 for anti‐PD‐1 group, n = 7 for combination group). J) Representative flow plots and quantification of IFN‐γ and TNF‐α co‐expression in the intratumoral CD8+CD45+ T cells of the αKG group and control group from Renca and B16‐F10 tumor‐bearing mice (n = 5 for Rat IgG group, n = 3 for αKG group, n = 4 for anti‐PD‐1 group, n = 6 for combination group). Error bars represent S.E.M. log‐rank (Mantel–Cox) test was used for (E) and (F). Two‐way ANOVA was used for (C), (D), (G), (H), (I), and (J). *p < 0.05, **p < 0.01, ***p < 0.001, and ****p < 0.0001. Scale bars represent 1 cm for (C,D).
