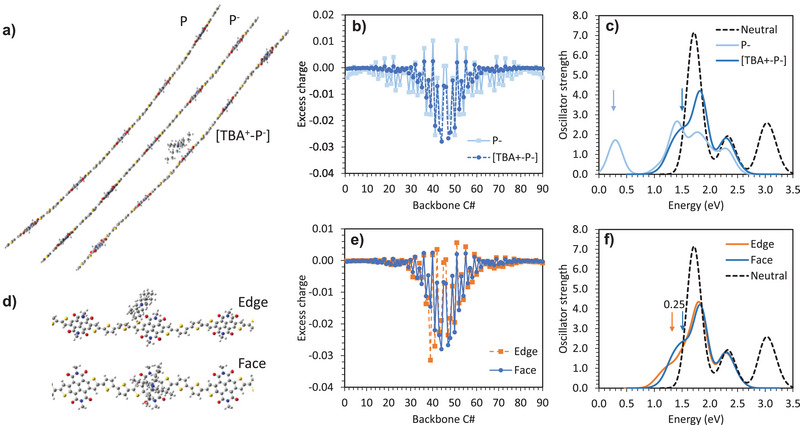
Figure 4.

Characteristics of doped pNDTI‐TT oligomer obtained by DFT calculations: a) chain geometry of neutral state P, reduced state without counterion P−, and reduced state with counterion [TBA+‐P−]; b) polaron charge distribution for P− and [TBA+‐P−]; c) optical absorption spectrum for P, P−, and [TBA+‐P−], the position of the polaron peak shown by the arrow reflects how strongly bound the polaron is; d) “edge” and “face” locations of TBA+ counterion relative to pNDTI‐TT oligomer (chains truncated for clarity); the associated polaron charge distributions are shown in (e) and optical absorption spectra in (f). We note that, although there is no substantial, visible difference in the polaron delocalization, the shape of the polaron charge distribution is noticeably different, as influenced by the position of the counterion relative to the pNDTI‐TT unit where the polaron is centered, as shown in (e).
