
Figure 3. Parasites lacking BFD2 fail to generate brain cysts in mice.
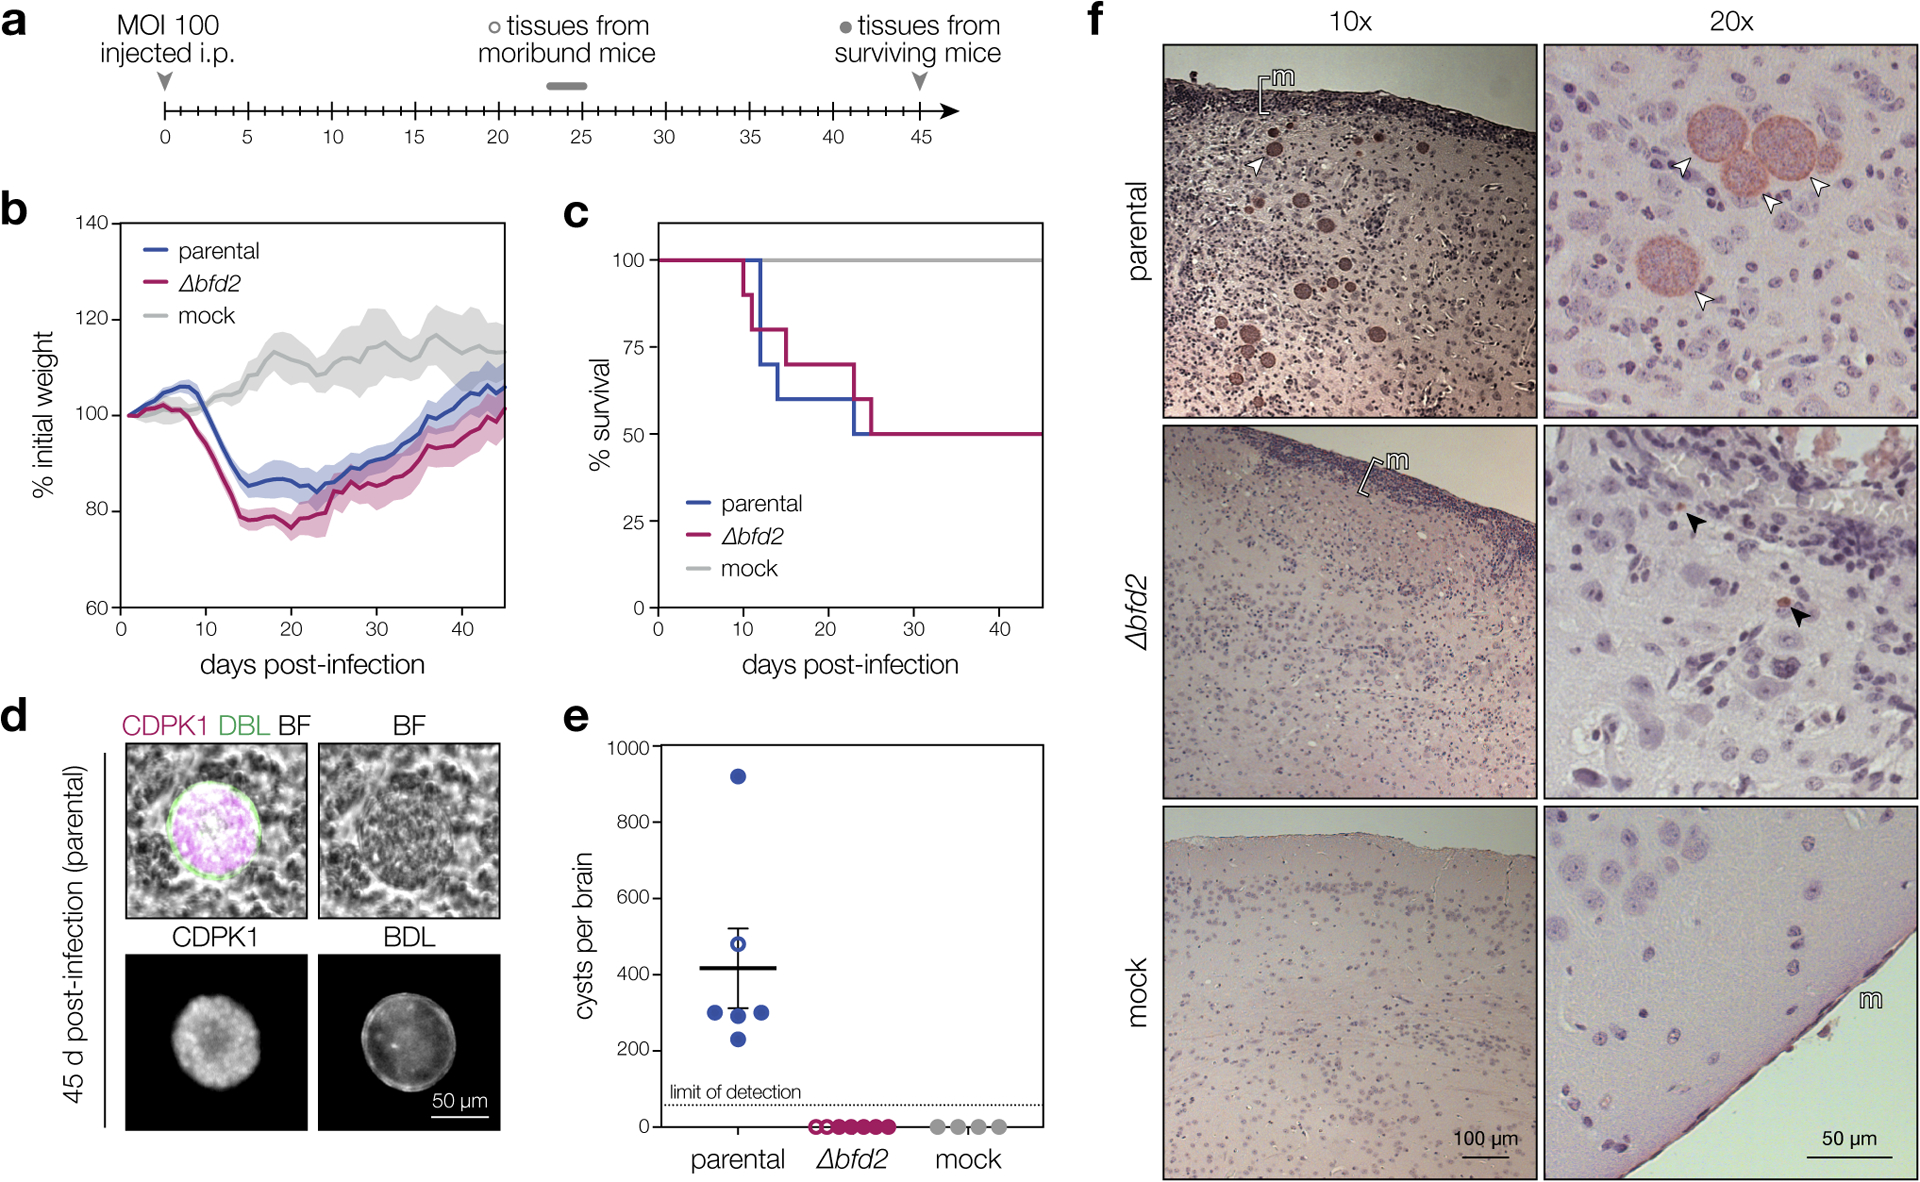
a, Timeline of mouse infections. CD-1 female mice were infected i.p. with 100 tachyzoites from each strain (n = 10) or buffer alone (n = 4). Cyst burdens were assessed in all moribund animals at the time of euthanasia and in surviving animals 45 days post-infection. b–c, Normalized weights (b) and survival (c) of animals in each infection group. Mean weight ± s.e.m. plotted for all surviving animals at a given time point. d, Representative cyst produced by the parental strain. The cyst wall is stained with DBL (green) and individual parasites are stained with CDPK1 (magenta). All structures scored as cysts in e were double-positive for DBL and CDPK1. e, Cyst burden per infected brain. Graphs reflect counts from surviving animals (closed circles) as well as all moribund animals sacrificed after 23 days of infection (open circles). Mean ± s.e.m. plotted for all cyst counts from parental-, Δbfd2-, and mock-infected animals (n = 6, 7, and 4, respectively) regardless of status at the time of brain harvest. f, Histology of brain sections from infected and mock-infected animals. Representative images at 10x and 20x magnification are shown for each strain. The meninges (m) are shown, with regions of inflammation highlighted with brackets. Cysts and individual parasites are indicated with white and black arrows, respectively. Samples were prepared from all surviving mice (closed circles in e) and selected images are representative of phenotypes observed throughout each infection cohort.