
Figure 4. BFD1 and BFD2 comprise a positive-feedback loop.
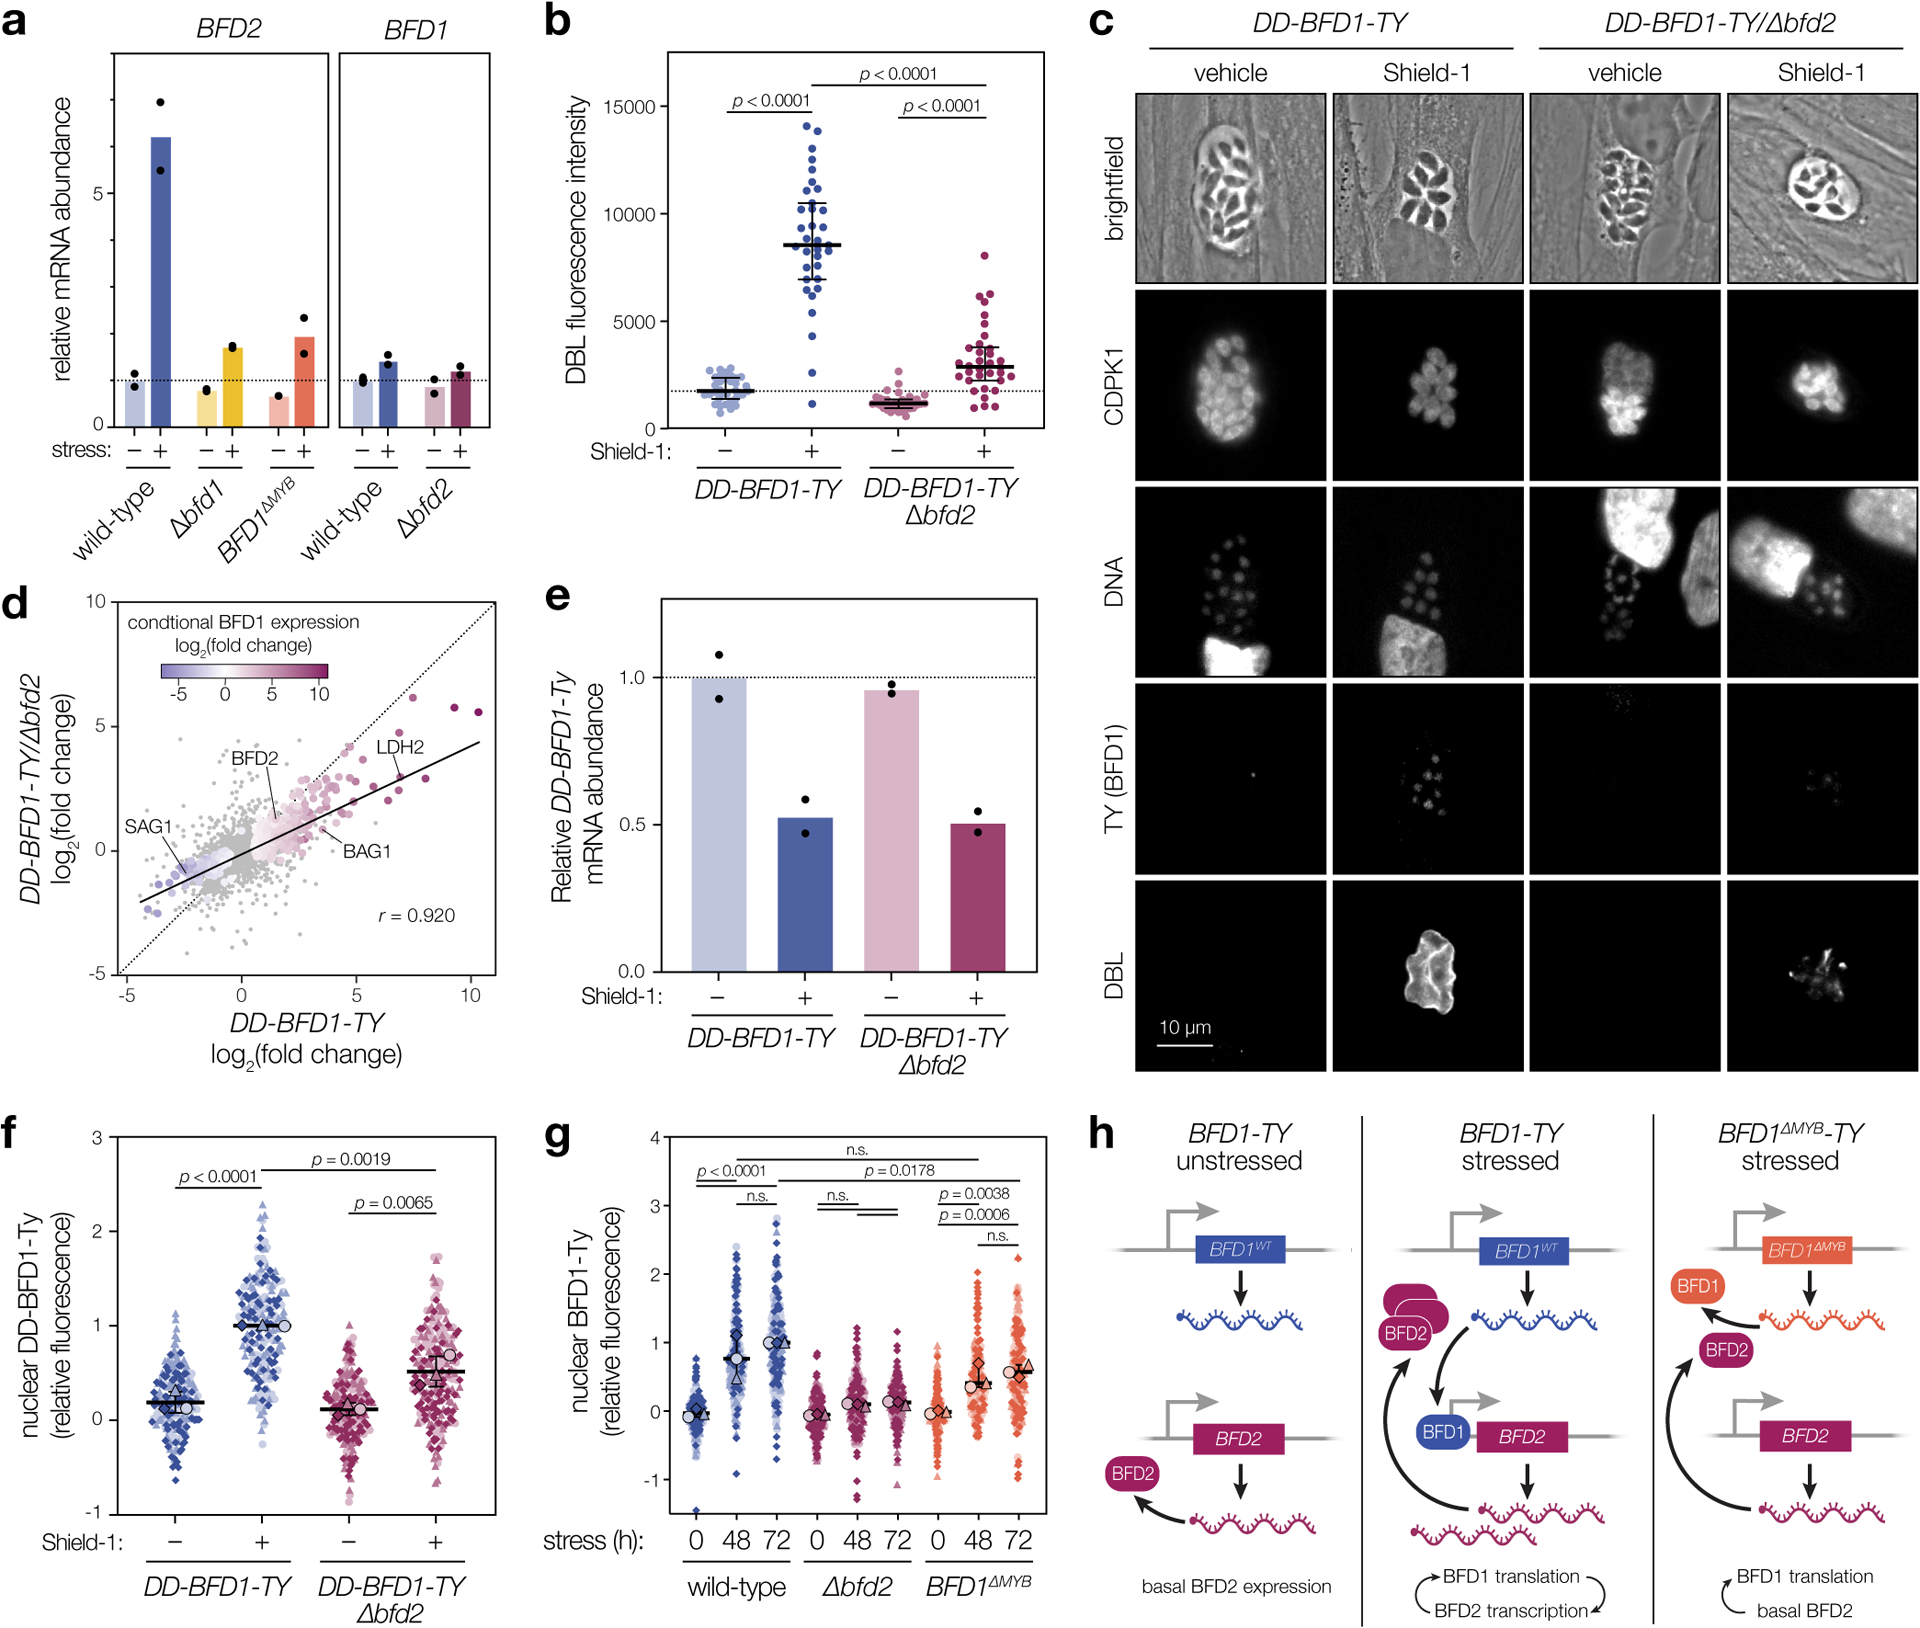
a, RT-qPCR of BFD1 and BFD2 mRNA after 48 h under alkaline-stressed or unstressed conditions. Wild-type and BFD1ΔMYB refer to the version of BFD1 expressed. Mean transcript abundance (n = 2 biological replicates) plotted relative to GCN5B, with normalization to the unstressed wild-type sample. See Supplementary Table 4 for CT values and analysis. b, DBL staining intensity after 48 h in Shield-1 or vehicle. Data quantified for a single replicate representative of assays performed in biological triplicate. Median ± IQR plotted for n = 34 vacuoles per condition. c, Representative vacuoles after 48 h in Shield-1 or vehicle. Parasites are labeled with CDPK1, DNA with Hoechst, BFD1 via the TY epitope, and differentiated vacuoles with DBL. d, Comparison of transcriptional changes in DD-BFD1-TY versus DD-BFD1-TYΔbfd2 parasites after 48 h of Shield-1 or vehicle treatment. Genes significantly affected in either sample (adjusted p < 0.05, Wald test in DESeq2) are colored by fold change during conditional BFD1 expression23. Pearson correlation performed on all significant points with trend line fit by linear regression. e, RT-qPCR of DD-BFD1-TY transcripts after 72 h in Shield-1 or vehicle. Relative quantification performed as in a, with normalization to vehicle-treated DD-BFD1-TY samples. Mean plotted for n = 2 independent infections. See Supplementary Table 5 for analysis. f, Quantification of BFD1 staining in c. Data are normalized to the mean of Shield-1-treated DD-BFD1-TY samples. Mean ± s.d. plotted for n = 3 infections, with replicate means (large points) generated from at least 59 parasite nuclei (small points) per strain. g, Quantification of BFD1 staining under alkaline-stressed or unstressed conditions. Mean ± s.d. plotted for n = 3 infections, with replicate data normalized to the 72 h-stressed wild-type mean. h, Model of BFD1-BFD2 feedback. In acute stages (left), BFD2 is basally expressed; BFD1 is transcribed but not translated. Under stress (center), BFD2 promotes BFD1 translation which, in turn, enhances BFD2 transcription. If BFD1 is nonfunctional (right), transcriptional activation of BFD2 does not occur, so BFD1 is not maximally induced. In b,f,g: n.s., p > 0.05; One-way ANOVA with Tukey’s correction.