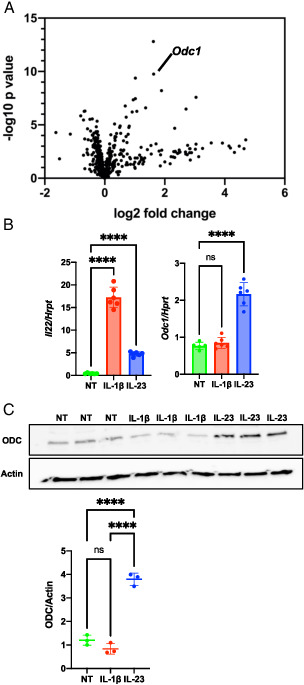
FIGURE 1.

ODC is upregulated in IL-23–activated ILC3s.
(A) MNK-3 cells were treated with IL-23 for 4 h or left untreated and analyzed by NanoString nCounter analysis using a mouse metabolism panel with 748 genes and 20 internal reference genes. Shown is a volcano plot with the Odc1 marked. (B) MNK-3 cells were treated with IL-23 or IL-1β for 4 h or left untreated (NT). Il22 and Odc1 mRNA levels were semiquantitated by real-time RT-PCR. Each point represents one well, and bars indicate mean. n = 6. Data are representative of three independent experiments. (C) MNK-3 cells were treated with IL-23 or IL-1β for 18 h or left NT, and cell lysates were analyzed by Western blotting to examine ODC and actin levels. Each point represents one well, and lines indicate means. n = 3. Data are representative of two independent experiments. ****p < 0.0001. Differences that were not significant (p > 0.05) are marked as “ns.”
