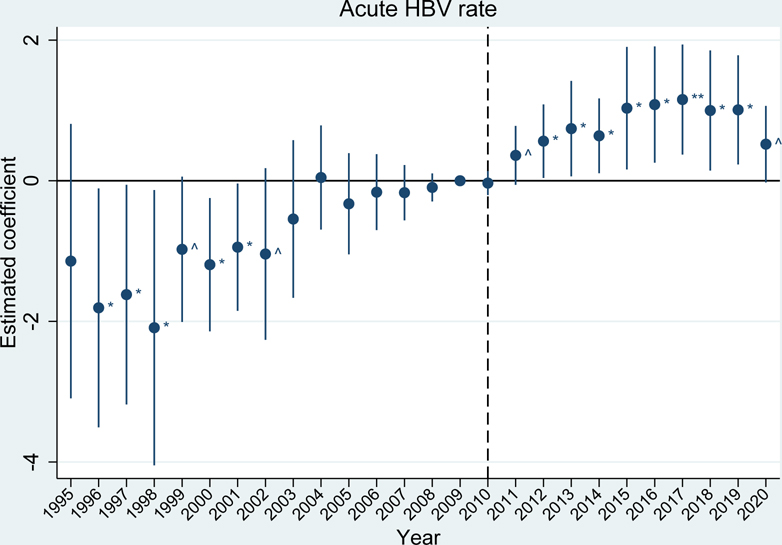
EXHIBIT 2.
Differences in incidence of acute HBV between U.S. states with high versus low exposure to initial OxyContin marketing
Source/Notes: SOURCE Authors’ analysis of the proxy for initial OxyContin marketing from CDC WONDER and rates of acute hepatitis B virus (HBV) per 100,000 from CDC Viral Hepatitis Surveillance reports. NOTES The vertical dotted line indicates the 2010 OxyContin reformulation. The estimated coefficient represents the estimated difference between the high and low exposure groups (95% confidence intervals are also shown). ^ p<0.10, * p<0.05, ** p<0.01. Differences are relative to the year before the OxyContin reformulation (2009). Event study models were estimated using linear regression, which included state and year fixed effects. All regressions were weighted by state population and standard errors were clustered by state.

