

Abstract
Pulsed electron paramagnetic resonance (EPR) based distance measurements using the recently developed Cu2+-DPA label present a promising strategy for measuring DNA backbone distance constraints. Herein we develop force field parameters for Cu2+-DPA in order to understand the features of this label at an atomic level. We perform molecular dynamics (MD) simulations using the force field parameters of Cu2+-DPA on four different DNA duplexes. The distance between the Cu2+ centers, extracted from the 2 μs MD trajectories, agree well with the experimental distance for all the duplexes. Further analyses of the trajectory provide insight into the orientation of the Cu2+-DPA inside the duplex that leads to such agreement with experiment. The MD results also illustrate the ability of the Cu2+-DPA to report on the DNA backbone distance constraints. Furthermore, measurement of fluctuations of individual residues showed that the flexibility of Cu2+-DPA in a DNA depends on the position of the label in the duplex, and a 2 μs MD simulation is not sufficient to fully capture the experimental distribution in some cases. Finally, the MD trajectories were utilized to understand the key aspects of the double electron electron resonance (DEER) results. The lack of orientational selectivity effects of the Cu2+-DPA at Q-band frequency are rationalized in terms of fluctuations in the Cu2+ coordination environment and rotameric fluctuations of the label linker. Overall, a combination of EPR and MD simulations based on the Cu2+-DPA labelling strategy can contribute towards understanding changes in DNA backbone conformations during protein-DNA interactions.
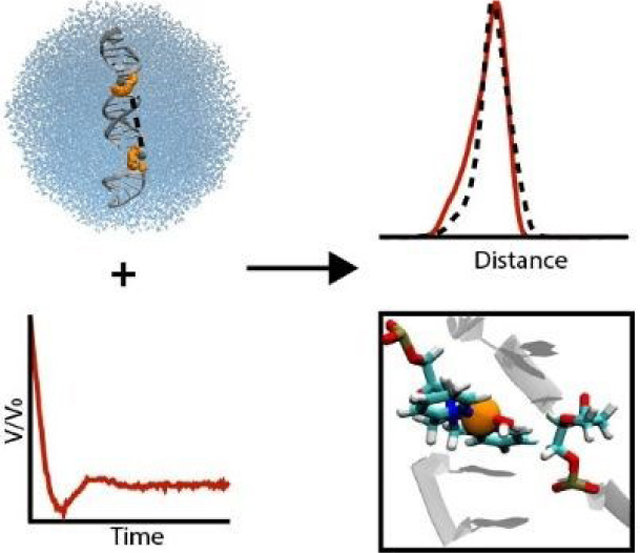
Graphical Abstract
MD simulations highlight how EPR distance constraints from Cu2+-DPA labels can be interpreted in terms of DNA structure.
Introduction
The DNA helix has a wide range of sequence dependent conformational variability and internal dynamics that are essential for its role in biological processes1–5. The DNA helix undergoes breathing, bending and twisting motions, as well as fluctuations in the helical groove that impart flexibility to the helix. Such dynamics are crucial in many important physiological processes. For example, sequence-dependent bending of DNA is an important criterion for protein-DNA recognition and the function of several DNA-binding proteins, such as transcription regulators and restriction enzymes. In recent times, electron paramagnetic resonance (EPR) spectroscopy has increasingly become important for measuring such conformational dynamics in DNA.
In particular, distance measurements by pulsed EPR techniques are an important approach for elucidating macromolecular conformations and flexibility6,7. These EPR techniques exploit the dipolar coupling between unpaired electron spins to provide distances in the nanometer range with angstrom-level resolution7–18. Such distance constraints can be employed to probe conformational changes in large and complex systems such as membrane proteins, chaperones, protein-protein and protein-nucleic acid complexes, that are otherwise inaccessible to other biophysical techniques19–27.
For such measurements site-specific labelling28–30 of the biomolecule is needed. A wide variety of labels have been developed towards this purpose31,32. For nucleic acids, the spin labels are incorporated by modification of nucleobase33–41, backbone42–45 or terminal capping46,47. Nitroxide based labels are commonly used in DNA. Labels such as the cytidine analogue or C-spin48–50 are highly rigid and provide information on label orientations51–53. More recently, a sterically shielded nitroxide label, known as G-spin label,54 has been reported that is introduced post synthetically. The G-spin label binds non-covalently to an abasic site and is present close to the helix. Additionally, distance measurements at physiological temperatures have been made possible by the triarylmethyl (TAM) radical55,56. Moreover, paramagnetic spin labels such as Mn2+, Gd3+ and Cu2+ have also been used to label nucleic acids57–60.
One such labelling strategy that has shown promise is a Cu2+ chelated to the ligand 2,2’-dipicolylamine (DPA) phosphoramidite61. The DPA moiety is nucleotide independent and can be easily introduced at any desired positions in the duplex during the synthesis. In addition, the label is structure independent and thus, does not depend on any specific combinations of bases to bind to, such as a guanine quadruplex. The complementary site to the Cu2+-DPA in the opposing strand contains an abasic site (dSpacer). We recently reported distance measurements performed on several duplexes that were labelled at two sites with the Cu2+-DPA62. The experimental most probable distances agreed with the predicted distances using the known values of base pair separation for a B-DNA. Moreover, molecular dynamics (MD) simulations performed on an unlabelled DNA also suggested that the most probable distance measured from the experiment agreed with the corresponding C3’-C3’ or C4’-C4’ backbone distances. These results suggest that the most probable distances obtained using Cu2+-DPA labels can be used to report on the DNA backbone conformations in solution62.
However, EPR distance measurements provide sparse constraints and therefore, can benefit from complementary technique, such as simulations using force field parameters of the labels to better describe the dynamical behaviour. MD simulations including the spin labels combined with EPR distance constraints have provided valuable information on conformational dynamics of nucleic acids, relative orientation of double-stranded helices and flexibility of DNA for a specific sequence53,54,63–65. Such MD simulations can also provide insight into the global (DNA) and local (spin label) motions. The development of accurate force fields for the spin label is, however, a pre-requisite for such MD simulations.
In this work, we have developed force field parameters for Cu2+-DPA and its complementary base, dSpacer. Density functional theory (DFT) calculations were utilized to generate the optimized geometry of Cu2+-DPA and the dSpacer. Consequently, parameters of bond lengths, bond angles, dihedral angles, partial charges, and force constants were developed. We then performed MD simulations with these force fields to better understand the atomic details of the flexibility of DNA as well as the label, Cu2+-DPA. The simulations were performed on duplexes with base pair separations of 9 to 12 between the Cu2+-DPA labels. We ran the MD simulations for as long as 2 μs to sample the label dynamics that occur on much longer timescales. These long simulations provide insight into the shape and width of the experimental distance distributions that were observed in Cu2+-DPA labelled DNA62,66, the experimental methodology used to measure distances by EPR, and the spatial distribution of the Cu2+-DPA label in the context of the DNA.
Experimental
HYSCORE
Four-pulse hyperfine sublevel correlation (HYSCORE)67 experiments were performed at 20 K and at X-band frequencies. The pulse sequence π/2 – τ – π/2 – t1 – π – t2 – π/2 – τ – echo was used. HYSCORE was performed at the field of highest intensity. The initial time delays for τ, t1 and t2 was set at 128, 200 and 200 ns, respectively. The delay for t1 and t2 had a step size of 16 ns for a total of 256 points. The pulse lengths used were 16 ns and 32 ns for π/2 and π pulses, respectively. A four-step phase cycling was used to eliminate the unwanted echos68,69. The raw 2D time-domain signals were analysed and processed using the Hyscorean open-source software package70 in MATLAB to produce the 2D frequency-domain contour plot.
DFT optimization
The Cu2+ is coordinated to three nitrogen atoms of the DPA in the equatorial plane. Therefore, the remaining sites in the Cu2+-DPA complex can be occupied by one, two or three water molecules, depending on the geometry. To find out the most possible Cu2+-DPA structure, we performed ab initio calculations using a density functional theory (DFT) with the solvent effect being taken into account with the Polarizable Continuum Model implemented in Gaussian 16 software package71. We first conducted geometry optimizations at the wB97xd/6–311++G(2d,p) level for three possible Cu2+-DPA complexes with 1, 2 and 3 coordinated water molecules. The complexation energy of introducing a water molecule to a Cu2+DPA complex was then calculated. After the most probable Cu2+-DPA complex was identified, we performed vibrational frequency analysis to derive the bond stretching and bond angle bending force constants for the complex at B3LYP/6–31G* level after geometry optimization. Lastly, HF/6–31G* single point calculations were performed to generate electrostatic potentials (ESP) for the Restrained ESP charge fitting. All zero-point energy (ZPE) calculations were performed using the same DFT model as optimization. More information on partial charges, atom types and other force field parameters and residue topologies of the Cu2+-DPA are provided in the ESI.
MD simulations
First, the Nucleic Acid Builder (NAB) module in the AMBER software suite72 was used to create the unlabelled B-DNA models, with Cu2+-DPA and dSpacer positions replaced by adenine and thymine, respectively. The adenine and thymine residues at the specific sites were then replaced by the DFT-optimized structures of Cu2+-DPA and dSpacer in PyMOL73. The Cu2+-DPA and dSpacer incorporated DNA were then subjected to MD simulations. The AMBER parmbsc1 force field63 was used to treat the nucleic acids. For the modified nucleotide residue, we first developed force field parameters for a model compound as shown in Figure 1, using a strategy detailed previously74. The residue topologies and the key force field parameters of Cu2+-DPA and dSpacer are provided in ESI. The solvent water was treated with TIP3P water model75. The DNA duplexes were solvated in a 12 Å truncated octahedral water box. For each DNA duplex, 100 Cl− ion were added to the water box so that the final Cl− concentration is about 0.15 M and the counter ion Na+ were then added to neutralize the whole system. The energy minimization and molecular dynamics simulations were performed using the pmemd program in the AMBER16 software package76. The solvated systems were first energy-minimized with a harmonic restraint force applied to the DNA residues except for the Cu2+-DPA and dSpacer. The restraint force was gradually reduced from 20, 10, 5, 1 and finally to 0 kcal/(mol Å2). The systems were then gradually heated from 50, 100, 150, 200, 250 to 298.15 K. The systems were equilibrated for 2 ns before starting the production MD runs. The time step for integration for heating, equilibration and the production run were set to 2 fs. Periodic boundary conditions along with particle mesh Ewald (PME)77 were applied to account for long-range electrostatic interactions under NPT (P=1 atm) conditions. SHAKE78 was used to restrain all bonds involving hydrogen and a nonbonded cutoff of 10 Å was applied. All visualizations for simulations were done using VMD79.
Figure 1:

Cu2+-DPA-DNA duplex with the Cu2+-DPA motif (highlighted by a rectangle) and the dSpacer (highlighted by a circle). The base pair separation between the two Cu2+-DPA motifs is denoted by n.
Results and Discussion
In this work we systematically examined four Cu2+-DPA-DNA duplexes using MD simulations. Figure 1 shows a Cu2+-DPA-DNA duplex with two Cu2+-DPA motifs, one on each strand, and a dSpacer, complementary to the Cu2+-DPA. The base pair separations (n) between the Cu2+-DPA motifs were monotonically increased from 9 to 12. The distance distributions on these duplexes have been reported previously62.
DFT optimized structure agrees well with crystal structure
We first identified the most probable structure from three possible Cu2+-DPA complexes with 1, 2 or 3 water molecules, using high-level DFT-optimizations at the wB97xd/6–311++G(2d,p) level. The optimized geometries are shown in Figure 2. We observed that Cu2+-DPA-WAT3 is not stable as one Cu-OH2 distance is 3.988 Å (Figure 2A), and this water molecule is likely a solvent water. The complexation energy of adding one water to Cu2+-DPA to form Cu2+-DPA-WAT1 (Figure 2C) is −19.59 kcal/mol and −16.99 kcal/mol after ZPE correction. On the other hand, the energy after adding another water molecule in Cu2+-DPA-WAT2 (Figure 2B) is only −8.06 kcal/mol and −5.86 kcal/mol after ZPE correction. Considering the vaporization energy of water is −9.75 kcal/mol, Cu2+-DPA-WAT2 is unlikely to be formed in aqueous solvent. Thus, the most probable Cu2+-DPA structure contains only one water molecule.
Figure 2:

Cu2+-DPA structures coordinated with A) three B) two and C) one water molecule.
Besides water, the most probable Cu2+-DPA complex, as shown in Figure 3A, also has the Cu2+ coordinated to three nitrogen atoms of the DPA (N1, N2 and N3), similar to what the crystal structure showed80. Previous continuous wave EPR data on Cu2+-DPA-DNA61,62 have reported g‖ and A‖ values that were also consistent with three nitrogen coordinating to Cu2+ at equatorial positions. On comparing the bond lengths and bond angles between the DFT-optimized and crystal structures, we found a reasonable agreement, as shown in Figure 3B. Furthermore, the optimized geometry did not accommodate any axial water coordination. This absence of axial water coordination indicates a square planar geometry of Cu2+-DPA that is in accordance with the crystal structure80.
Figure 3:

A) DFT optimized structure of Cu2+-DPA B) Comparison of bond angles and bond lengths with crystal structure80 of Cu2+-DPA show reasonable agreement with the DFT-optimized structure.
HYSCORE indicates the presence of the fourth equatorially coordinating atom
In order to experimentally verify the equatorial water coordination to Cu2+-DPA and Cu2+-DPA placed in DNA, we performed HYSCORE experiments. Figure 4A shows the 1H HYSCORE spectrum of Cu2+-DPA which displays two proton features. First, the broad ridge spanning a width of 6–9 MHz, highlighted by the rectangles in Figure 4A, is a characteristic feature of solvent coordination in the equatorial plane81–84. Since three of the equatorial coordination sites of Cu2+ are occupied with DPA nitrogen atoms, it leaves space for only one solvent molecule to bind equatorially. Second, the short intense ridge around the proton Larmor frequency (~14 MHz), highlighted by the circle in Figure 4A, can be a consequence of weakly coupled protons of solvent molecules or axial coordination to water82. Since crystal structure of Cu2+-DPA shows a square planar geometry80, the proton feature at ~14 MHz is likely due to the weakly coupled protons of solvent molecules83. We then performed HYSCORE on one of the Cu2+-DPA-DNA duplexes (n=11). The HYSCORE spectrum of the Cu2+-DPA-DNA duplex, shown in Figure 4B, closely resembles that of the Cu2+-DPA, showing both the features of equatorial water coordination and weakly coupled solvent molecules. Furthermore, a Cu2+-proton distance of 2.5 Å was estimated from the HYSCORE features (details in ESI). This distance is in good agreement with the 2.4 Å Cu2+-proton distance in the DFT-optimized structure.
Figure 4:

1H HYSCORE spectra of A) Cu2+-DPA B) Cu2+-DPA-DNA and C) Cu2+-control DNA, analysed to the same contour levels. In Cu2+-DPA and Cu2+-DPA-DNA, the proton signal results from equatorially coordinated water molecule (rectangle) and weakly coupled solvent (circle). In control DNA, the proton signal results from only weakly coupled solvent molecules.
To compare how Cu2+ coordination to water differs in the presence and absence of DPA inside the DNA duplex, we performed HYSCORE on a Cu2+-bound control DNA, lacking any DPA phosphoramidite or dSpacer. The sequence of the control DNA is the same as the Cu2+-DPA-DNA duplex, except the Cu2+-DPA and dSpacer positions were replaced by adenine and thymine, respectively. The proton signature in the HYSCORE spectrum, shown in Figure 4C, clearly lacks the features of equatorial water coordination as seen in Cu2+-DPA-DNA. Instead, the spectrum only shows the short intense ridge around ~14 MHz. Overall, from the HYSCORE spectra we inferred that the Cu2+-DPA is coordinated to a solvent molecule in the equatorial plane, as also observed in the DFT-optimized Cu2+-DPA structure.
MD simulations show that the Cu2+-Cu2+ distance reasonably agrees with the backbone distance
Next, we performed 2 μs MD simulations on the Cu2+-DPA and dSpacer incorporated into the DNA duplexes, with n varying from 9 to 12. Figure 5A shows the Cu2+-DPA phosphoramidite with the backbone carbon atom, C’ marked in red. The corresponding Cu2+-Cu2+ and C’-C’ distances in a Cu2+-DPA-DNA duplex are shown using solid black and dashed red lines, respectively. We chose C’ as the backbone atom for the Cu2+-DPA phosphoramidite as it is the central point to which the DPA moiety is attached. Moreover, the C’ atom best represents the C3’ or C4’ backbone atoms of an unmodified regular nucleotide62.
Figure 5:

A) Cu2+-DPA phosphoramidite with the backbone carbon atom, C’ marked in red. The Cu2+-Cu2+ distance is denoted by the black solid line and the backbone C’-C’ distance is represented by the red dashed line in a Cu2+-DPA-DNA duplex. The Cu2+-Cu2+ distance (black solid) is compared with the backbone distance (red dashed) for B) n=9 C) n=10 D) n=11 and E) n=12 base pair separations. F) Plot showing the Cu2+-Cu2+ and C’-C’ most probable distances from MD simulations.
Figures 5B–E show the comparison between the Cu2+-Cu2+ and C’-C’ distance distributions obtained from 2 μs trajectories for each DNA duplex. Figure 5F shows a plot of the most probable Cu2+-Cu2+ and C’-C’ distances from the MD. As can be seen, all the distances agree well within ~2 Å. The plot, therefore, highlights that an important advantage of the Cu2+-DPA labelling strategy is that the label can reasonably report on the DNA backbone constraints, without any additional modelling.
The agreement between the Cu2+ and backbone C’ distance distributions is due to a combination of three factors. First, the size of the linker is much smaller than standard DNA labels. From the MD simulations, the average length of the Cu2+ atom from the C’ backbone atom, ranges from 3.5 to 4.5 Å for the different DPA sites. The linker length in Cu2+-DPA is, therefore, considerably smaller than traditional labels, which can be a nanometer long85,86. Second, the Cu2+ is arranged within the helix (cf. below). As a result, the offset due to the linker partially cancels. Finally, the Cu2+-Cu2+ distance within the DNA helix can be considered as a sum of two components: an axial distance, which increases linearly with the base pair separation and a radial distance (i.e. from backbone to the label), which oscillates with base pair separation. As the two modified sites are separated by at least 9 base pairs, the axial vector (~31 Å for n=9) is significantly longer than the radial counterpart, i.e., the Cu2+-Cu2+ distance is dominated by the axial component. Indeed, previous work has shown that such considerations are valid for n>4 62. Consequently, the separation between the Cu2+ centers along the DNA axis is roughly the same as the separation between the DNA backbone atoms.
Cu2+-DPA-DNA based MD simulations capture the experimental most probable distance
Next, we compared the distance distributions obtained from MD simulations to the experimental distance distributions. The experimental data and distance distributions for 9 to 12 base pair separations have been reported previously62. The direct comparison of the experimental and MD distance distribution is provided in ESI. Figure 6A shows the comparison of the most probable Cu2+-Cu2+ distances from the first 1 μs (red triangles) and entire 2 μs (black circles) MD simulations and EPR data (grey squares) for the four Cu2+-DPA-DNA duplexes. The distances agree well within 2 Å which is within the error of the experiments62. A linear trend with a y-intercept of 0 was obtained with a slope of 3.5 Å, for all the results from the experiment and MD simulations. These values agree well with each other as well as with the ~3.4 Å separation between adjacent bases, as observed in a B-DNA duplex87.
Figure 6:

Plot of A) most probable Cu2+-Cu2+ distances and B) standard deviation of distance distributions from EPR measurements (grey squares), 1 μs MD (red triangles) and 2 μs MD (black circles) against base pair separation (n). A direct comparison of the experimental and MD distance distributions is provided in ESI.
Figure 6B shows the comparison of the standard deviation of the distance distributions obtained from the experimental data (grey squares) and MD simulations (red triangles for 1 μs and black circles for 2 μs). Analysing the initial 1 μs MD trajectories shows a large discrepancy between the experiment and MD for all the duplexes. Extending the simulation time to 2 μs reduces this discrepancy for duplexes n=9, 10 and 12. However, for duplex n=11 there is no improvement with simulation time. This result may indicate that the labels in duplex n=11 have restricted mobility, and therefore limited sampling of rotamers is observed during the 2 μs simulation. This effect is analysed in further detail below. Overall, while longer simulation time may be required to capture the full distribution width, the most probable distance can be achieved with a short simulation time of 1 μs or less (details in ESI).
Orientation of Cu2+-DPA helps reduce the effect of linker offset
To elucidate spin label conformations that yield the most probable distance, we extracted the frames from the MD trajectories for which the Cu2+-Cu2+ distance is within ± 1 Å of the MD most probable distance. The analysis is shown in Figure 7A. Each frame was aligned with respect to the O-C-C’-O backbone atoms, marked in red in Figure 7B. Figures 7C–D show the spatial distribution of Cu2+ for the DPA sites corresponding to the most probable distance. As can be seen from Figure 7D, the Cu2+ is directed towards the axis of the DNA duplex. This orientation of the Cu2+ significantly contributes to the close agreement between the Cu2+-Cu2+ and backbone distance distributions (cf. Figure 7D).
Figure 7:

A) The frames from MD trajectories considered for obtaining the spatial distribution of Cu2+ are within ± 1 Å of the Cu2+-Cu2+ most probable distance and shown by the shaded region B) The frames are aligned with respect to the Cu2+-DPA backbone atoms marked in red. C) The distribution of the Cu2+ centers for the Cu2+-DPA site 1 (blue, circles) and site 2 (orange, rectangles) for duplexes n= 9–12. D) The top-down view of the DNA where the blue and orange spheres represent the Cu2+ at Cu2+-DPA sites 1 and 2, respectively. The grey sphere represents the backbone carbon atom, C’.
In addition, we measured the angle between the DNA backbone and the Cu2+ for both the sites in the duplex, as shown in Figure 8A. Figure 8B shows the value of these angles for the different duplexes. Within the standard deviation, the values agree well with each other. Figure 8C shows that the average Cu2+ to backbone angles for each duplex are all between 80° to 100°. For a natural base, a similar analysis shows an angle of ~73° ± 6° with respect to the backbone atom (details provided in ESI). Thus, the Cu2+-DPA orientation to the DNA backbone is roughly similar to that of a natural base within the standard deviation and within the caveats of structural differences between the label and the natural base. These results suggest that the most probable spin label conformation has the Cu2+-ions present almost perpendicular to the DNA backbone. The perpendicular orientation of the Cu2+-DPA leads to the effects of linker length to partially cancel out when the Cu2+-Cu2+ distance is compared to the backbone distance.
Figure 8:

A) Angles between the C4’ atom of the adjacent base to the Cu2+-DPA (blue sphere), the C’ backbone atom of Cu2+-DPA (grey sphere) and the Cu2+ (cyan and orange for Cu2+-DPA site 1 and 2, respectively) B) Table showing the values of the angles for the two Cu2+-DPA sites C) Plot of the angles versus base pair separation for the two Cu2+-DPA sites.
MD simulations show that Cu2+-DPA have varied mobility that depends on position
In order to examine the motion of the Cu2+-DPA we first measured the root mean square fluctuation (RMSF) values of each base for all the DNA duplexes. The RMSF was calculated with reference to the average structure of each duplex and the results are shown in Figure 9. As expected, the bases at the 5’ and 3’ ends showed high RMSF and thereby, high flexibility. Interestingly, the flexibility of the Cu2+-DPA and the dSpacer is also elevated than other bases and are comparable to the nitroxide derivative of guanine54. These results are expected because Cu2+-DPA and the dSpacer lack intrastrand hydrogen bonding between them unlike regular base pairing. Importantly the difference in RMSF value between DPA and adjacent base is small for n=11. Furthermore, the RMSF values in Figure 9 are consistent with the fluctuations in θ1 and θ2 (cf. Figure 8B).
Figure 9:

The root mean square fluctuations (RMSF) of all the bases in the Cu2+-DPA-DNA duplexes with A) n=9 B) n=10 C) n=11 and D) n=12. The grey and black denote the two strands in the DNA and the red and blue denote Cu2+-DPA and dSpacer, respectively. As can be seen, the RMSF is high for the terminal bases, as expected. The RMSF for Cu2+-DPA and the abasic dSpacer positions are generally high, indicating more flexibility than the natural bases.
We analysed the spin label rotameric preferences from the MD trajectories to examine the mobility of the DPA in different sites. The Cu2+-DPA moiety is connected to the backbone by two rotatable bonds that are defined here by χ1 and χ2. These angles are shown in Figures 10A and 11A, respectively. The χ1 dihedral angles for both the Cu2+-DPA sites in each duplex are shown in Figures 10B–E. In duplexes n=9, 10 and 12, at least one of Cu2+-DPA sites sample both ±60° and ±180°, while in n=11 neither of the labels sample the full range. Figures 11B–E show the χ2 dihedral angles for both the Cu2+-DPA sites in each duplex. Overall, a large range of χ2 values (±60°, ±120° and ±180°) are sampled between the different Cu2+-DPA sites of the different duplexes. These observations suggest that the sampling of χ1 and χ2 dihedral angles contribute towards the flexibility of the label in a duplex, and that n=11 does not fully sample all rotameric states during the course of MD simulation.
Figure 10:

A) Dihedral angle denoted as χ1. The probability distribution of the dihedral angles for the two Cu2+-DPA labels in duplexes with B) n=9 C) n=10 D) n=11 and E) n=12. Both the Cu2+-DPA sites in duplex n=11 sample the least range of χ1 dihedrals.
Figure 11:

A) Dihedral angle denoted as χ2. B) Energy landscape for different orientations of Cu2+-DPA based on the dihedral angle, χ2. The probability distribution of the dihedral angles for the two Cu2+-DPA labels in duplexes with C) n=9 D) n=10 E) n=11 F) n=12.
Moreover, as evident from Figures 10 and 11, even within the same duplex, two Cu2+-DPA sites can have varied mobility. Such differences in the mobility depending on the location of the Cu2+-DPA site is not unreasonable given that local steric interactions with the neighbouring bases have a strong influence on the degree of motions of the label.
Finally, these results suggest that a 2 μs simulation may be insufficient, in cases, to fully capture the experimental distribution due to the slow motion of the label33,88–90. In addition, there may be contribution from other factors that lead to the discrepancy between the distribution widths in MD simulations vs the experiment. The experimental data was collected at 20 K which likely captures the conformations that exist in the glass state, while the simulation was performed at 298 K. Second, glycerol was used in the experiment to form a glass and as a cryoprotectant. It is possible that the presence of glycerol modified the solvation and dynamics of the DNA91,92.
MD simulations provide insight into the use of DEER for distance measurements
The MD results are also helpful to understand key principles of the double electron electron resonance (DEER) measurements on Cu2+-DPA labelled species. The pulses used in DEER excite only a small fraction of the total EPR spectrum. Such selective excitation can lead to selection of only a small portion of all possible molecular orientations, resulting in dependence of the measured signal on the magnetic field. This is often referred to as orientational selectivity59,93–101. Previous DEER results have shown the absence of orientational effects for Cu2+-DPA at both X-band and Q-band frequencies in the non-complexed state61,62. This is intriguing because Cu2+-based measurements on proteins using the dHis motif74,93,102–104 can be orientational selective at Q-band but not at X-band.
We examined the MD data to gain insight into these observations. Figure 12 shows the fluctuations of the bond lengths for bonds involving Cu2+. These bond lengths were extracted from the 2 μs MD trajectory on the n=11 duplex since previous Q-band data on this sample did not exhibit orientational selectivity62. The bond length between Cu2+ to N1 ranges from 1.9 to 2.3 Å, with an average bond length of 2.1 ± 0.1 Å (average ± s.d.). On the other hand, the bond length of Cu2+ to N2 was 1.9 ± 0.1 Å. These mean values agree well with the crystal structure80 (cf. Figure 3). Figure 13 shows the dihedral angles between Cu2+ and atoms in its immediate coordination environment. The dihedral angles, labelled as N1, N2 and N3, show values of −75° ± 23°, −20° ± 7° and 19° ± 6° (average ± s.d.) respectively and are similar for the two Cu2+-DPA sites. The ensemble measured by DEER is therefore expected to contain proteins trapped in these different coordination environments.
Figure 12:

Fluctuations in bond length between Cu2+ and two coordinating nitrogen atoms – A) bond between Cu2+ and the backbone N1 atom B) fluctuations in Cu2+-N1 bond length in the two DPA sites, sampled over 2 μs of MD for the duplex n=11 (top chart) and the probability distribution (bottom chart) C) and D) same analysis repeated for bond length between Cu2+ and the pyridine N2 atom. A change of ~ 25% in the bond length is observed for Cu2+-N1 and ~30% for Cu2+-N2.
Figure 13:

Dihedral angles measured between Cu2+ and its coordinating atoms for 2 μs of MD run on Cu2+-DPA-DNA duplex with n=11. The dihedral angle is denoted by the red arrow (top chart). Bottom chart shows the probability distribution of the dihedrals between the two Cu2+-DPA sites, Cu2+-DPA1 (blue) and Cu2+-DPA2 (orange).
Such variations in the coordination environment of Cu2+ have significant influence on the g-tensor of the label. Accordingly, we calculated the g-tensor values and orientations for 100 snapshots from our MD using ORCA105,106. For these calculations, we sampled every 10 ns of the first 1 μs trajectory of duplex n=11. The distribution in g‖ orientations shows dramatic variations with as much as a 25o change, as shown in cyan in Figure 14. Due to its 180o symmetry93,97, the g orientations show both ‘up’ and ‘down’ orientations with respect to the plane of the Cu2+-DPA moiety. This is not unexpected and has been observed before93,97. In addition to this distribution of g‖ in the two Cu2+ centers, there is also additional contribution due to the fluctuations of the dihedral angles χ1 and χ2 (cf. Figures 10 and 11).
Figure 14:

The distribution of g‖ directions (cyan) in the Cu2+-DPA system, sampled every 10 ns of the 1 μs MD run. The blue and red bonds show the Cu2+ coordination with nitrogen and oxygen, respectively. The cyan represents the g‖. The g-tensor calculations were performed with ORCA105,106.
Together these two effects have significant implications on the relative orientations of the g-tensors of the two Cu2+ spins in the DNA duplex. The relative angles of the two g-tensors are defined by three angles that are shown in Figure 15A. χ is the angle between the g∥ axis and the interspin vector, r. γ is the angle between the g∥ axis of spin A and its projection on spin B. η is the angle between the g⊥ axis of spin A and its projection on spin B.
Figure 15:

A) The relative orientations between the two spins, A and B, are indicated by three angles, χ, γ and η. B) The echo-detected field swept spectrum of Cu2+-DPA-DNA duplex with n=11 at Q-band frequency. The red lines show the fields at which DEER was simulated. C) The simulated DEER time traces at each field at the Q-band frequency. The y-axis is offset for ease of visualization. The red dashed line represents the first period of the modulations for all fields. D) Background subtracted time domain data at g‖ (11220 G, dashed) and g⊥ (11820 G, solid) regions. The figure shows the lack of orientational selectivity effects at Q-band frequency for Cu2+-DPA.
The three angles, namely χ, γ, and η, were calculated via the MDTraj software107 for 100 snapshots of the Cu2+-DPA-DNA duplex with n=11. From our analysis, we obtained an average of 103° ± 69° (average ± s.d.), 87° ± 36° and 93° ± 44° for χ, η and γ, respectively. Similar analysis of angles for the dHis-Cu2+ protein label have shown a standard deviation of ~10–12° for each set of angles74,93. Thus, the Cu2+-DPA labels have an orientational distribution that is significantly larger compared to the dHis-Cu2+ label used for proteins The key distinguishing feature appears to be the smaller contribution from side-chain fluctuations in the dHis motif74,93.
We utilized the values of χ, γ, and η angles and performed simulations to obtain individual time-domain DEER signals at various magnetic fields using the methodology reported previously108. The parameters used for the simulations include the g and hyperfine tensor values for Cu2+-DPA (g‖ = 2.247, g⊥ = 2.054, A‖ = 170 G and A⊥ = 17 G62). We also used the experimental most probable distance of 3.78 nm and a standard deviation of 0.38 nm for the distance distribution for duplex n=11. Figure 15B shows the eight different magnetic fields where we have previously reported DEER for n=1162 and where the simulations are carried out in this work. As can be seen from Figure 15C, the simulated DEER time traces have the same period at all fields. Furthermore, Figure 15D shows that there is no difference in the dipolar frequency at the g⊥ (11820 G) and g‖ (11220 G) regions, indicating the lack of any orientational selectivity effects at Q-band frequency.
Many orientations are excited even at a single magnetic field
In order to visualize how the effects of orientational selectivity is mitigated, we chose one Cu2+ centre as the reference and aligned its g‖ axis to overlay 100 structures of Cu2+-DPA-DNA, evenly sampled from the 1 μs MD simulations. Figure 16 shows the locations of the second Cu2+ (orange) and the reference Cu2+ center is shown as a black sphere. As is evident from the figure, even at a single magnetic field corresponding to g‖, there is a large number of molecular orientations that can exist. In general, the finite bandwidth of pump pulse in DEER leads to an excitation of an even wider range of molecular orientations at a particular magnetic field. Such occurrence is a combined consequence of fluctuations in the dihedral angles, χ1 and χ2 and in the coordination environment of Cu2+ leading to a large distribution in the g-tensor orientations.
Figure 16:

MD frames of Cu2+-DPA-DNA duplex (n=11) sampled every 10 ns for the first 1 μs. The black sphere in the center is the reference Cu2+. All frames are aligned to the g‖ axis of the reference Cu2+. The second Cu2+ position is represented as orange spheres. The g‖ direction, marked in the figure, is calculated from ORCA105,106.
Conclusions
In conclusion, we have, for the first time, provided tools for modelling of Cu2+-DPA by developing force field parameters. The DFT-optimized structure of the label was in reasonable agreement with the crystal structure. Additionally, the most energy favourable DFT-structure had one equatorial water coordination and was consistent with HYSCORE results on the Cu2+-DPA-DNA duplex. We have shown that the distance between the Cu2+ centers from the MD simulations can directly report on the DNA backbone distances. In addition, the most probable Cu2+-Cu2+ distance obtained from the experiment and the MD agree within ~2 Å. Further analyses showed that the Cu2+-DPA moiety is positioned inside the DNA helix and oriented roughly perpendicular to the DNA backbone, corresponding to the most probable distance. The motions of the label are slow such that simulation longer than 2 μs may be needed, in cases, to adequately capture the experimental distance distribution. Finally, the MD results illustrated that the fluctuations of the Cu2+ coordination environment, together with the linker flexibility, lead to a wide distribution of the relative orientation of the two Cu2+ g-tensors. This distribution is large enough to dilute any orientational effects, even at Q-band frequency. Overall, the development of force field parameters for the Cu2+ labels will enable the use of MD simulations to better interpret EPR distance constraints in understanding the role of DNA in protein-DNA interactions.
Supplementary Material
Acknowledgements
This research was supported by the National Science Foundation [NSF-BSF MCB-2006154, NSF 1955260] and the National Institutes of Health [NIH: R01 GM079383]. S.G. would like to thank the University of Pittsburgh for the Andrew Mellon Predoctoral Fellowship. We would also like to thank Dr. Lillian Chong and Anthony Bogetti for the useful discussions on MD simulations. All simulations were carried out at the University of Pittsburgh’s Center for Research Computing.
Footnotes
Conflicts of interest
There are no conflicts to declare.
Electronic Supplementary Information (ESI) available: [details of any supplementary information available should be included here]. See DOI: 10.1039/x0xx00000x
References
- 1.Parker SC, Hansen L, Abaan HO, Tullius TD and Margulies EH, Local DNA topography correlates with functional noncoding regions of the human genome, Science, 2009, 324, 389–392. [DOI] [PMC free article] [PubMed] [Google Scholar]
- 2.Rohs R, West SM, Sosinsky A, Liu P, Mann RS and Honig B, The role of DNA shape in protein-DNA recognition, Nature, 2009, 461, 1248–1253. [DOI] [PMC free article] [PubMed] [Google Scholar]
- 3.Harteis S. and Schneider S, Making the bend: DNA tertiary structure and protein-DNA interactions, Int. J. Mol. Sci, 2014, 15, 12335–12363. [DOI] [PMC free article] [PubMed] [Google Scholar]
- 4.Reginsson GW, Shelke SA, Rouillon C, White MF, Sigurdsson ST and Schiemann O, Protein-induced changes in DNA structure and dynamics observed with noncovalent site-directed spin labeling and PELDOR, Nucleic Acids Res., 2013, 41, e11. [DOI] [PMC free article] [PubMed] [Google Scholar]
- 5.Krumkacheva OA, Shevelev GY, Lomzov AA, Dyrkheeva NS, Kuzhelev AA, V Koval V, Tormyshev VM, Polienko YF, V Fedin M, V Pyshnyi D, Lavrik OI and Bagryanskaya EG, DNA complexes with human apurinic/apyrimidinic endonuclease 1: structural insights revealed by pulsed dipolar EPR with orthogonal spin labeling, Nucleic Acids Res., 2019, 47, 7767–7780. [DOI] [PMC free article] [PubMed] [Google Scholar]
- 6.Borbat PP and Freed JH, in Biological Magnetic Resonance, eds. Timmel C. and Harmer J, Kluwer Academic/Plenum Publishers, New York, 2000, pp. 1–82. [Google Scholar]
- 7.Jeschke G, DEER distance measurements on proteins, Annu. Rev. Phys. Chem, 2012, 63, 419–446. [DOI] [PubMed] [Google Scholar]
- 8.Milov AD, Maryasov AG and Tsvetkov YD, Pulsed electron double resonance (PELDOR) and its applications in free-radicals research, Appl. Magn. Reson, 1998, 15, 107–143. [Google Scholar]
- 9.Ruthstein S, Ji M, Shin BK and Saxena S, A simple double quantum coherence ESR sequence that minimizes nuclear modulations in Cu2+-ion based distance measurements, J. Magn. Reson, 2015, 257, 45. [DOI] [PubMed] [Google Scholar]
- 10.Ji M, Ruthstein S. and Saxena S, Paramagnetic metal ions in pulsed ESR distance distribution measurements, Acc. Chem. Res, 2014, 47, 688–695. [DOI] [PubMed] [Google Scholar]
- 11.Pannier M, Veit S, Godt A, Jeschke G. and Spiess HW, Dead-Time Free Measurement of Dipole-Dipole Interactions between Electron Spins, J. Magn. Reson, 2000, 142, 331–340. [DOI] [PubMed] [Google Scholar]
- 12.Saxena S. and Freed JH, Double quantum two-dimensional Fourier transform electron spin resonance: Distance measurements, Chem. Phys. Lett, 1996, 251, 102–110. [Google Scholar]
- 13.V Kulik LV, Dzuba SAA, Grigoryev IAA and Tsvetkov YD, Electron dipole–dipole interaction in ESEEM of nitroxide biradicals, Chem. Phys. Lett, 2001, 343, 315–324. [Google Scholar]
- 14.Milikisyants S, Scarpelli F, Finiguerra MG, Ubbink M. and Huber M, A pulsed EPR method to determine distances between paramagnetic centers with strong spectral anisotropy and radicals: The dead-time free RIDME sequence, J. Magn. Reson, 2009, 201, 48–56. [DOI] [PubMed] [Google Scholar]
- 15.Jeschke G, Pannier M, Godt A. and Spiess HW, Dipolar spectroscopy and spin alignment in electron paramagnetic resonance, Chem. Phys. Lett, 2000, 331, 243–252. [Google Scholar]
- 16.Schmidt T, Wälti MA, Baber JL, Hustedt EJ and Clore GM, Long Distance Measurements up to 160 Å in the GroEL Tetradecamer Using Q-Band DEER EPR Spectroscopy, Angew. Chemie Int. Ed, 2016, 55, 15905–15909. [DOI] [PMC free article] [PubMed] [Google Scholar]
- 17.Becker JS and Saxena S, Double quantum coherence electron spin resonance on coupled Cu(II)–Cu(II) electron spins, Chem. Phys. Lett, 2005, 414, 248–252. [Google Scholar]
- 18.Ruthstein S, Ji M, Mehta P, Jen-Jacobson L. and Saxena S, Sensitive Cu2+–Cu2+ Distance Measurements in a Protein–DNA Complex by Double-Quantum Coherence ESR, J. Phys. Chem. B, 2013, 117, 6227–6230. [DOI] [PMC free article] [PubMed] [Google Scholar]
- 19.Stone KM, Townsend JE, Sarver J, Sapienza PJ, Saxena S. and Jen-Jacobson L, Electron spin resonance shows common structural features for different classes of EcoRI-DNA complexes, Angew. Chemie Int. Ed, 2008, 47, 10192–10194. [DOI] [PMC free article] [PubMed] [Google Scholar]
- 20.Grote M, Polyhach Y, Jeschke G, Steinhoff H, Schneider E. and Bordignon E, Transmembrane signaling in the maltose ABC transporter MalFGK2-E, J. Biol. Chem, 2009, 284, 17521–17526. [DOI] [PMC free article] [PubMed] [Google Scholar]
- 21.Hagelueken G, Ingledew WJ, Huang H, Petrovic-Stojanovska B, Whitfield C, ElMkami H, Schiemann O. and Naismith JH, PELDOR Spectroscopy Distance Fingerprinting of the Octameric Outer-Membrane Protein Wza from Escherichia coli., Angew. Chemie Int. Ed, 2009, 48, 2904–2906. [DOI] [PMC free article] [PubMed] [Google Scholar]
- 22.Drescher M, Huber M. and Subramaniam V, Hunting the Chameleon: Structural Conformations of the Intrinsically Disordered Protein Alpha-Synuclein, ChemBioChem, 2012, 13, 761–768. [DOI] [PubMed] [Google Scholar]
- 23.Joseph B, Sikora A, Bordignon E, Jeschke G, Cafiso DS and Prisner TF, Distance Measurement on an Endogenous Membrane Transporter in E. coli Cells and Native Membranes Using EPR Spectroscopy, Angew. Chemie Int. Ed, 2015, 54, 6196–6199. [DOI] [PMC free article] [PubMed] [Google Scholar]
- 24.Puljung MC, DeBerg HA, Zagotta WN and Stoll S, Double electron-electron resonance reveals cAMP-induced conformational change in HCN channels, Proc. Natl. Acad. Sci. USA, 2014, 111, 9816–9821. [DOI] [PMC free article] [PubMed] [Google Scholar]
- 25.Sahu ID, Dixit G, Reynolds W, Harding B, Jaycox C, Faleel FDM, McCarrick RM, Sanders CR and Lorigan GA, Studying Conformation of the Voltage-Sensor Domain (VSD) of the Human KCNQ1 Potassium Ion Channel in Proteoliposomes using EPR Spectroscopy, Biophys. J, 2019, 116, 26a. [Google Scholar]
- 26.Schmidt T, Schwieters CD and Clore GM, Spatial domain organization in the HIV-1 reverse transcriptase p66 homodimer precursor probed by double electron-electron resonance EPR, Proc. Natl. Acad. Sci. USA, 2019, 116, 17809–17816. [DOI] [PMC free article] [PubMed] [Google Scholar]
- 27.Giannoulis A, Feintuch A, Barak Y, Mazal H, Albeck S, Unger T, Yang F, Su XC and Goldfarb D, Two closed ATP- And ADP-dependent conformations in yeast Hsp90 chaperone detected by Mn(II) EPR spectroscopic techniques, Proc. Natl. Acad. Sci. USA, 2020, 117, 395–404. [DOI] [PMC free article] [PubMed] [Google Scholar]
- 28.Hubbell WL, Mchaourab HS, Altenbach C. and Lietzow MA, Watching proteins move using site-directed spin labeling, Structure, 1996, 4, 779–783. [DOI] [PubMed] [Google Scholar]
- 29.Jeschke G. and Polyhach Y, Distance measurements on spin-labelled biomacromolecules by pulsed electron paramagnetic resonance, Phys. Chem. Chem. Phys, 2007, 9, 1895–1910. [DOI] [PubMed] [Google Scholar]
- 30.Hubbell WL, Lopez CJ, Altenbach C. and Yang Z, Technological advances in site-directed spin labeling of proteins, Cur. Opin. Struct. Biol, 2013, 23, 725–733. [DOI] [PMC free article] [PubMed] [Google Scholar]
- 31.Shelke SA and Sigurdsson ST, Site-directed spin labelling of nucleic acids, Eur. J. Org. Chem, 2012, 2012, 2291–2301. [Google Scholar]
- 32.Shelke SA and Sigurdsson ST, in Modified Nucleic Acids, Springer, 2016, vol. 31, pp. 159–187. [Google Scholar]
- 33.Schiemann O, Piton N, Mu Y, Stock G, Engels JW and Prisner TF, A PELDOR-based nanometer distance ruler for oligonucleotides, J. Am. Chem. Soc, 2004, 126, 5722–5729. [DOI] [PubMed] [Google Scholar]
- 34.Sicoli G, Wachowius F, Bennati M. and Hobartner C, Probing secondary structures of spin-labeled RNA by pulsed EPR spectroscopy, Angew. Chemie Int. Ed, 2010, 49, 6443–6447. [DOI] [PubMed] [Google Scholar]
- 35.Babaylova ES, V Ivanov A, Malygin AA, Vorobjeva MA, Venyaminova AG, Polienko YF, Kirilyuk IA, Krumkacheva OA, V Fedin M, Karpova GG and Bagryanskaya EG, A versatile approach for site-directed spin labeling and structural EPR studies of RNAs, Org. Biomol. Chem, 2014, 12, 3129–3136. [DOI] [PubMed] [Google Scholar]
- 36.Saha S, Jagtap AP and Sigurdsson ST, Site-directed spin labeling of 2′-amino groups in RNA with isoindoline nitroxides that are resistant to reduction, Chem. Commun, 2015, 51, 13142–13145. [DOI] [PubMed] [Google Scholar]
- 37.Erlenbach N, Endeward B, Schöps P, Gophane DB, Sigurdsson ST and Prisner TF, Flexibilities of isoindoline-derived spin labels for nucleic acids by orientation selective PELDOR, Phys. Chem. Chem. Phys, 2016, 18, 16196–16201. [DOI] [PubMed] [Google Scholar]
- 38.Halbmair K, Seikowski J, Tkach I, Hobartner C, Sezer D. and Bennati M, High-resolution measurement of long-range distances in RNA: pulse EPR spectroscopy with TEMPO-labeled nucleotides, Chem. Sci, 2016, 7, 3172–3180. [DOI] [PMC free article] [PubMed] [Google Scholar]
- 39.Frolow O, Endeward B, Schiemann O, Prisner TF and Engels JW, Nitroxide Spin labeled RNA for long range distance measurements by EPR-PELDOR, Nucleic Acids Symp. Ser, 2008, 52, 153–154. [DOI] [PubMed] [Google Scholar]
- 40.Kerzhner M, Abdullin D, Wiecek J, Matsuoka H, Hagelueken G, Schiemann O. and Famulok M, Post-synthetic spin-labeling of RNA through click chemistry for PELDOR measurements, Chem. Eur. J, 2016, 22, 12113–12121. [DOI] [PubMed] [Google Scholar]
- 41.Cai Q, Kusnetzow AK, Hubbell WL, Haworth IS, Gacho GPC, Van Eps N, Hideg K, Chambers EJ and Qin PZ, Site-directed spin labeling measurements of nanometer distances in nucleic acids using a sequence-independent nitroxide probe, Nucleic Acids Res., 2006, 34, 4722–4730. [DOI] [PMC free article] [PubMed] [Google Scholar]
- 42.Nguyan PH, Popova A, Hideg K. and Qin PZ, A nucleotide-independent cyclic nitroxide label for monitoring segmental motions in nucleic acids, BMC Biophys., 2016, 8, 6–14. [DOI] [PMC free article] [PubMed] [Google Scholar]
- 43.Popova AM, Kálai T, Hideg K. and Qin PZ, Site-specific DNA structural and dynamic features revealed by nucleotide-independent nitroxide probes, Biochemistry, 2009, 48, 8540–8550. [DOI] [PMC free article] [PubMed] [Google Scholar]
- 44.Qin PZ, Haworth IS, Cai Q, Kusnetzow AK, Grant GPG, Price EA, Sowa GZ, Popova A, Herreros B. and He H, Measuring nanometer distances in nucleic acids using a sequence-independent nitroxide probe, Nat. Protoc, 2007, 2, 2354–2365. [DOI] [PMC free article] [PubMed] [Google Scholar]
- 45.Haugland MM, El-Sagheer AH, Porter RJ, Pena J, Brown T, Anderson EA and Lovett JE, 2′-Alkynylnucleotides: A sequence- and spin label-flexible strategy for EPR spectroscopy in DNA, J. Am. Chem. Soc, 2016, 138, 9069–9072. [DOI] [PubMed] [Google Scholar]
- 46.Shevelev GY, Krumkacheva O, Lomzov AA, Kuzhelev AA, V Trukhin D, Rogozhnikova OY, Tormyshev VM, V Pyshnyi D, V Fedin M. and Bagryanskaya EG, Triarylmethyl labels: Toward improving the accuracy of EPR nanoscale distance measurements in DNAs, J. Phys. Chem. B, 2015, 119, 13641–13648. [DOI] [PMC free article] [PubMed] [Google Scholar]
- 47.Fedin MV, Shevelev GY, Pyshnyi DV, Tormyshev VM, Jeschke G, Yulikov M. and Bagryanskaya EG, Interaction of triarylmethyl radicals with DNA termini revealed by orientation-selective W-band double electron–electron resonance spectroscopy, Phys. Chem. Chem. Phys, 2016, 18, 29549–29554. [DOI] [PMC free article] [PubMed] [Google Scholar]
- 48.Barhate N, Cekan P, Massey AP and Sigurdsson ST, A nucleoside that contains a rigid nitroxide spin label: a fluorophore in disguise., Angew. Chemie Int. Ed, 2007, 46, 2655–2658. [DOI] [PubMed] [Google Scholar]
- 49.Cekan P. and Sigurdsson ST, Conformation and dynamics of nucleotides in bulges and symmetric internal loops in duplex DNA studied by EPR and fluorescence spectroscopies, Biochem. Biophys. Res. Commun, 2012, 420, 656–661. [DOI] [PubMed] [Google Scholar]
- 50.Cekan P, Smith AL, Barhate N, Robinson BH and Sigurdsson ST, Rigid spin-labeled nucleoside C: a nonperturbing EPR probe of nucleic acid conformation, Nucleic Acids Res., 2008, 36, 5946–5954. [DOI] [PMC free article] [PubMed] [Google Scholar]
- 51.Edwards TE, Cekan P, Reginsson GW, Shelke SA, Ferré-D’Amaré AR, Schiemann O. and Sigurdsson ST, Crystal structure of a DNA containing the planar, phenoxazine-derived bi-functional spectroscopic probe C, Nucleic Acids Res., 2011, 39, 4419–4426. [DOI] [PMC free article] [PubMed] [Google Scholar]
- 52.Marko A, Denysenkov V, Margraf D, Cekan P, Schiemann O, Sigurdsson ST and Prisner TF, Conformational felxibility of DNA, J. Am. Chem. Soc, 2011, 133, 13375–13379. [DOI] [PubMed] [Google Scholar]
- 53.Stelzl LS, Erlenbach N, Heinz M, Prisner TF and Hummer G, Resolving the conformational dynamics of DNA with ångstrom resolution by PELDOR and molecular dynamics, J. Am. Chem. Soc, 2017, 139, 11674–11677. [DOI] [PubMed] [Google Scholar]
- 54.Heinz M, Erlenbach N, Stelzl LS, Thierolf G, Kamble NR, Sigurdsson ST, Prisner TF and Hummer G, High-resolution EPR distance measurements on RNA and DNA with the non-covalent Ǵ spin label, Nucleic Acids Res., 2020, 48, 924–933. [DOI] [PMC free article] [PubMed] [Google Scholar]
- 55.Shevelev GY, Krumkacheva OA, Lomzov AA, Kuzhelev AA, Rogozhnikova OY, Trukhin DV, Troitskaya TI, Tormyshev VM, Fedin MV, Pyshnyi DV and Bagryanskaya EG, Physiological-Temperature Distance Measurement in Nucleic Acid using Triarylmethyl-Based Spin Labels and Pulsed Dipolar EPR Spectroscopy, J. Am. Chem. Soc, 2014, 136, 9874–9877. [DOI] [PubMed] [Google Scholar]
- 56.Kuzhelev AA, Krumkacheva OA, Shevelev GY, Yulikov M, Fedin MV and Bagryanskaya EG, Room-temperature distance measurements using RIDME and the orthogonal spin labels trityl/nitroxide, Phys. Chem. Chem. Phys, 2018, 20, 10224–10230. [DOI] [PubMed] [Google Scholar]
- 57.Donohue MP and Szalai VA, Distance measurements between paramagnetic ligands bound to parallel stranded guanine quadruplexes, Phys. Chem. Chem. Phys, 2016, 18, 15447–15455. [DOI] [PMC free article] [PubMed] [Google Scholar]
- 58.Wojciechowski F, Gross A, Holder IT, Knorr L, Drescher M, Hartig JS, Groß A, Holder IT, Knörr L, Drescher M. and Hartig JS, Pulsed EPR spectroscopy distance measurements of DNA internally labelled with Gd3+-DOTA, Chem. Comm, 2015, 51, 13850–13853. [DOI] [PubMed] [Google Scholar]
- 59.Engelhard DM, Meyer A, Berndhäuser A, Schiemann O. and Clever GH, Di-copper( ii ) DNA G-quadruplexes as EPR distance rulers, Chem. Commun, 2018, 54, 7455–7458. [DOI] [PubMed] [Google Scholar]
- 60.Song Y, Meade TJ, Astashkin AV, Klein EL, Enemark JH and Raitsimring A, Pulsed dipolar spectroscopy distance measurements in biomacromolecules labeled with Gd(III) markers, J. Magn. Reson, 2011, 210, 59–68. [DOI] [PMC free article] [PubMed] [Google Scholar]
- 61.Lawless MJ, Sarver JL and Saxena S, Nucleotide independent Cu(II) based distance measurements in DNA by pulsed EPR, Angew. Chemie Int. Ed, 2017, 56, 2115–2117. [DOI] [PubMed] [Google Scholar]
- 62.Ghosh S, Lawless MJ, Brubaker HJ, Singewald K, Kurpiewski MR, Jen-Jacobson L. and Saxena S, Cu2+-based distance measurements by pulsed EPR provide distance constraints for DNA backbone conformations in solution, Nucleic Acids Res., 2020, 48, e49. [DOI] [PMC free article] [PubMed] [Google Scholar]
- 63.Ivani I, Dans PD, Noy A, Pérez A, Faustino I, Hospital A, Walther J, Andrio P, Goñi R, Balaceanu A, Portella G, Battistini F, Gelpí JL, González C, Vendruscolo M, Laughton CA, Harris SA, Case DA and Orozco M, Parmbsc1: a refined force field for DNA simulations, Nat. Methods, 2016, 13, 55–58. [DOI] [PMC free article] [PubMed] [Google Scholar]
- 64.Prior C, Danilane L. and Oganesyan VS, All-atom molecular dynamics simulations of spin labelled double and single-strand DNA for EPR studies, Phys. Chem. Chem. Phys, 2018, 20, 13461–13472. [DOI] [PubMed] [Google Scholar]
- 65.Gamble Jarvi A, Sargun A, Bogetti X, Wang J, Achim C. and Saxena S, Development of Cu(II)-based distance methods and force field parameters for the determination of PNA conformations and dynamics by EPR and MD simulations, J. Phys. Chem. B, 2020, 124, 7544–7556. [DOI] [PubMed] [Google Scholar]
- 66.Lawless MJ, Sarver J. and Saxena S, Nucleotide-independent copper(II)-based distance measurements in DNA by pulsed ESR spectroscopy, Angew. Chemie Int. Ed, 2017, 56, 2115–2117. [DOI] [PubMed] [Google Scholar]
- 67.Van Doorslaer S, in eMagRes, John Wiley & Sons, Ltd, Chichester, UK, 2017, vol. 6, pp. 51–70. [Google Scholar]
- 68.Fauth JM, Schweiger A, Braunschweiler L, Forrer J. and Ernst RR, Elimination of Unwanted Echoes and Reduction of Dead Time in Three-Pulse Electron Spin-Echo Spectroscopy, J. Magn. Reson, 1986, 66, 74–85. [Google Scholar]
- 69.Gemperle C, Aebli G, Schweiger A. and Ernst RR, Phase Cycling in Pulse EPR, J. Magn. Reson, 1990, 88, 241–256. [Google Scholar]
- 70.Fábregas Ibáñez L, Soetbeer J, Klose D, Tinzl M, Hilvert D. and Jeschke G, Non-uniform HYSCORE: Measurement, processing and analysis with Hyscorean, J. Magn. Reson, 2019, 307, 106576. [DOI] [PubMed] [Google Scholar]
- 71.Frisch MJ, Trucks GW, Sclegel HB, Scuseria GE, Robb MA, Cheeseman JR, Scalmani G, Barone V, Petersson GA, Nakatsuji H, Li X, Caricato M, Marenich AV, Bloino J, Janesko BG, Gomperts R, Mennucci B, Hratchian HP, Ortiz JV, Izmaylov AF, Sonnenberg JL, Williams-Young D, Ding F, Lipparini F, Egidi F, Goings J, Peng B, Petrone A, Henderson T, Ranasinghe D, Zakrzewski VG, Gao J, Rega N, Zheng G, Liang W, Hada M, Ehara M, Toyota K, Fukuda R, Hasegawa J, Ishida M, Nakajima T, Honda Y, Kitao O, Nakai H, Vreven T, Throssell K, Montgomery JA Jr., Peralta JE, Ogliaro F, Bearpark MJMJ, Heyd JJ, Brothers EN, Kudin KN, Staroverov VN, Keith TA, Kobayashi R, Normand J, Raghavachari K, Rendell AP, Burant JC, Iyengar SS, Tomasi J, Cossi M, Millam JM, Klene M, Adamo C, Cammi R, Ochterski JW, Martin RL, Morokuma K, Farkas O, Foresman JB and Fox DJ, Gaussian 16, Revision C.01, Gaussian Inc, Wellington 2016, Gaussian 16, Revis. C.01, Gaussian Inc, Wellingt [Google Scholar]
- 72.Case DA, Cheatham III TE, Darden T, Gohlke H, Luo R, Merz KM Jr., A. Onufriev, C. Simmerling, B. Wang and R. J. Woods, The Amber biomolecular simulation programs, J. Comput. Chem, 2005, 26, 1668–1688. [DOI] [PMC free article] [PubMed] [Google Scholar]
- 73.Delano WL, PyMOL: An Open-Source Molecular Graphics Tool, 2002. [Google Scholar]
- 74.Bogetti X, Ghosh S, Gamble Jarvi A, Wang J. and Saxena S, Molecular Dynamics Simulations Based on Newly Developed Force Field Parameters for Cu2+ Spin Labels Provide Insights into Double-Histidine-Based Double Electron-Electron Resonance, J. Phys. Chem. B, 2020, 124, 2788–2797. [DOI] [PubMed] [Google Scholar]
- 75.Jorgensen WL, Chandrasekhar J, Madura JD, Impey RW and Klein ML, Comparison of simple potential functions for simulating liquid water, J. Chem. Phys, 1983, 79, 926–935. [Google Scholar]
- 76.Case D, Betz R, Botello-Smith W, Cerutti D. and Darden T, Amber 16, Univ. California, San Fr [Google Scholar]
- 77.Darden T, York D. and Pedersen L, Particle mesh Ewald: An N log( N ) method for Ewald sums in large systems, J. Chem. Phys, 1993, 98, 10089–10092. [Google Scholar]
- 78.Ryckaert JP, Ciccotti G and Berendsen HJ, Numerical integration of the cartesian equations of motion of a system with constraints: molecular dynamics of n-alkanes, J. Comput. Phys, 1977, 23, 327–341. [Google Scholar]
- 79.Humphrey W, Dalke A. and Schulten K, VMD: Visual molecular dynamics, J. Mol. Graph, 1996, 14, 33–38. [DOI] [PubMed] [Google Scholar]
- 80.Choi K-Y, Ryu H, Sung N-D and Suh M, Synthesis, properties, and X-ray structure of [Cu(dpa)Cl2] (dpa = di-(2-picolyl)amine), J. Chem. Crystallogr, 2003, 33, 947–950. [Google Scholar]
- 81.Schosseler PM, Wehrli B. and Schweiger A, Complexation of Copper(II) with Carbonate Ligands in Aqueous Solution: A CW and Pulse EPR Study, Inorg. Chem, 1997, 36, 4490–4499. [DOI] [PubMed] [Google Scholar]
- 82.Santangelo MG, Medina-Molner A, Schweiger A, Mitrikas G. and Spingler B, Structural analysis of Cu(II) ligation to the 5′-GMP nucleotide by pulse EPR spectroscopy, J. Biol. Inorg. Chem, 2007, 12, 767–775. [DOI] [PubMed] [Google Scholar]
- 83.Burns CS, Aronoff-Spencer E, Dunham CM, Lario P, Avdievich NI, Antholine WE, Olmstead MM, Vrielink A, Gerfen GJ, Peisach J, Scott WG and Millhauser GL, Molecular features of the copper binding sites in the octarepeat domain of the prion protein, Biochemistry, 2002, 41, 3991–4001. [DOI] [PMC free article] [PubMed] [Google Scholar]
- 84.Pöppl A. and Kevan L, A practical strategy for determination of proton hyperfine interaction parameters in paramagnetic transition metal ion complexes by two-dimensional HYSCORE electron spin resonance spectroscopy in disordered systems, J. Phys. Chem, 1996, 100, 3387–3394. [Google Scholar]
- 85.Gophane DB, Endeward B, Prisner TF and Sigurdsson ST, Conformationally Restricted Isoindoline-Derived Spin Labels in Duplex DNA: Distances and Rotational Flexibility by Pulsed Electron–Electron Double Resonance Spectroscopy, Chem. Eur. J, 2014, 20, 15913–15919. [DOI] [PubMed] [Google Scholar]
- 86.Gophane DB and Sigurdsson ST, Hydrogen-bonding controlled rigidity of an isoindoline-derived nitroxide spin label for nucleic acids, Chem. Commun, 2013, 49, 999–1001. [DOI] [PubMed] [Google Scholar]
- 87.Olson WK, Gorin AA, Lu XJ, Hock LM and Zhurkin VB, DNA sequence-dependent deformability deduced from protein-DNA crystal complexes., Proc. Natl. Acad. Sci. USA, 1998, 95, 11163–8. [DOI] [PMC free article] [PubMed] [Google Scholar]
- 88.Galindo-Murillo R, Roe DR and Cheatham TE, Convergence and reproducibility in molecular dynamics simulations of the DNA duplex d(GCACGAACGAACGAACGC), Biochim. Biophys. Acta, 2015, 1850, 1041–1058. [DOI] [PMC free article] [PubMed] [Google Scholar]
- 89.von Hippel PH, Johnson NP and Marcus AH, 50 years of DNA ‘Breathing’: Reflections on old and new approaches [For special issue of biopolymers on 50 years of nucleic acids research], Biopolymers, 2013, 99, 923–954. [DOI] [PMC free article] [PubMed] [Google Scholar]
- 90.Frank-Kamenetskii MD and Prakash S, Fluctuations in the DNA double helix: A critical review, Phys. Life Rev, 2014, 11, 153–170. [DOI] [PubMed] [Google Scholar]
- 91.Georgieva ER, Roy AS, Grigoryants VM, Borbat PP, Earle KA, Scholes CP, Freed JH, Grigoryants M, Borbat PP, Earle KA, Scholes CP and Freed JH, Effect of freezing conditions on distances and their distributions derived from Double Electron Electron Resonance (DEER): A study of doubly-spin-labeled T4 lysozyme, J. Magn. Reson, 2012, 216, 69–77. [DOI] [PMC free article] [PubMed] [Google Scholar]
- 92.Sinibaldi R, Ortore MG, Spinozzi F, Carsughi F, Frielinghaus H, Cinelli S, Onori G. and Mariani P, Preferential hydration of lysozyme in water/glycerol mixtures: A small-angle neutron scattering study, J. Chem. Phys, 2007, 126, 235101. [DOI] [PubMed] [Google Scholar]
- 93.Gamble Jarvi A, Ranguelova K, Ghosh S, Weber RT and Saxena S, On the Use of Q-Band Double Electron–Electron Resonance To Resolve the Relative Orientations of Two Double Histidine-Bound Cu2+ Ions in a Protein, J. Phys. Chem. B, 2018, 122, 10669–10677. [DOI] [PubMed] [Google Scholar]
- 94.Schiemann O, Cekan P, Margraf D, Prisner TF and Sigurdsson ST, Relative Orientation of Rigid Nitroxides by PELDOR: Beyond Distance Measurements in Nucleic Acids, Angew. Chemie Int. Ed, 2009, 48, 3292–3295. [DOI] [PubMed] [Google Scholar]
- 95.Yang Z, Kise D. and Saxena S, An Approach towards the Measurement of Nanometer Range Distances Based on Cu 2+ Ions and ESR, J. Phys. Chem. B, 2010, 114, 6165–6174. [DOI] [PubMed] [Google Scholar]
- 96.Marko A, Margraf D, Cekan P, Sigurdsson ST, Schiemann O. and Prisner TF, Analytical method to determine the orientation of rigid spin labels in DNA, Phys. Rev. E, 2010, 81, 021911. [DOI] [PubMed] [Google Scholar]
- 97.Bowen AM, Jones MW, Lovett JE, Gaule TG, McPherson MJ, Dilworth JR, Timmel CR and Harmer JR, Exploiting orientation-selective DEER: Determining molecular structure in systems containing Cu(II) centres, Phys. Chem. Chem. Phys, 2016, 18, 5981–5994. [DOI] [PubMed] [Google Scholar]
- 98.Denysenkov VP, Prisner TF, Stubbe J. and Bennati M, High-field pulsed electron-electron double resonance spectroscopy to determine the orientation of the tyrosyl radicals in ribonucleotide reductase, Proc. Natl. Acad. Sci. USA, 2006, 103, 13386–13390. [DOI] [PMC free article] [PubMed] [Google Scholar]
- 99.Bode BE, Plackmeyer J, Prisner TF and Schiemann O, PELDOR Measurements on a Nitroxide-Labeled Cu(II) Porphyrin: Orientation Selection, Spin-Density Distribution, and Conformational Flexibility, J. Phys. Chem. A, 2008, 112, 5064–5073. [DOI] [PubMed] [Google Scholar]
- 100.Abé C, Klose D, Dietrich F, Ziegler WH, Polyhach Y, Jeschke G. and Steinhoff HJ, Orientation selective DEER measurements on vinculin tail at X-band frequencies reveal spin label orientations, J. Magn. Reson, 2012, 216, 53–61. [DOI] [PubMed] [Google Scholar]
- 101.Lovett JE, Bowen AM, Timmel CR, Jones MW, Dilworth JR, Caprotti D, Bell SG, Wong LL and Harmer J, Structural information from orientationally selective DEER spectroscopy, Phys. Chem. Chem. Phys, 2009, 11, 6840. [DOI] [PubMed] [Google Scholar]
- 102.Cunningham TF, Putterman MR, Desai A, Horne WS and Saxena S, The Double-Histidine Cu2+-Binding Motif: A Highly Rigid, Site-Specific Spin Probe for Electron Spin Resonance Distance Measurements, Angew. Chemie Int. Ed, 2015, 54, 6330–6334. [DOI] [PMC free article] [PubMed] [Google Scholar]
- 103.Lawless MJ, Ghosh S, Cunningham TF, Shimshi A. and Saxena S, On the use of the Cu2+–iminodiacetic acid complex for double histidine based distance measurements by pulsed ESR, Phys. Chem. Chem. Phys, 2017, 19, 20959–20967. [DOI] [PubMed] [Google Scholar]
- 104.Ghosh S, Lawless MJ, Rule GS and Saxena S, The Cu2+-nitrilotriacetic acid complex improves loading of α-helical double histidine site for precise distance measurements by pulsed ESR, J. Magn. Reson, 2018, 286, 163–171. [DOI] [PubMed] [Google Scholar]
- 105.Neese F, The ORCA program system, WIREs Comput. Mol. Sci, 2012, 2, 73–78. [Google Scholar]
- 106.Neese F, Software update: the ORCA program system, version 4.0, WIREs Comput. Mol. Sci, 2018, 8, e1327. [Google Scholar]
- 107.McGibbon RT, Beauchamp KA, Harrigan MP, Klein C, Swails JM, Hernández CX, Schwantes CR, Wang LP, Lane TJ and Pande VS, MDTraj: A Modern Open Library for the Analysis of Molecular Dynamics Trajectories, Biophys. J, 2015, 109, 1528–1532. [DOI] [PMC free article] [PubMed] [Google Scholar]
- 108.Yang Z, Kise D. and Saxena S, An approach towards the measurement of nanometer range distance based on Cu2+ ions and ESR, J. Phys. Chem. B, 2010, 114, 6165–6174. [DOI] [PubMed] [Google Scholar]
Associated Data
This section collects any data citations, data availability statements, or supplementary materials included in this article.