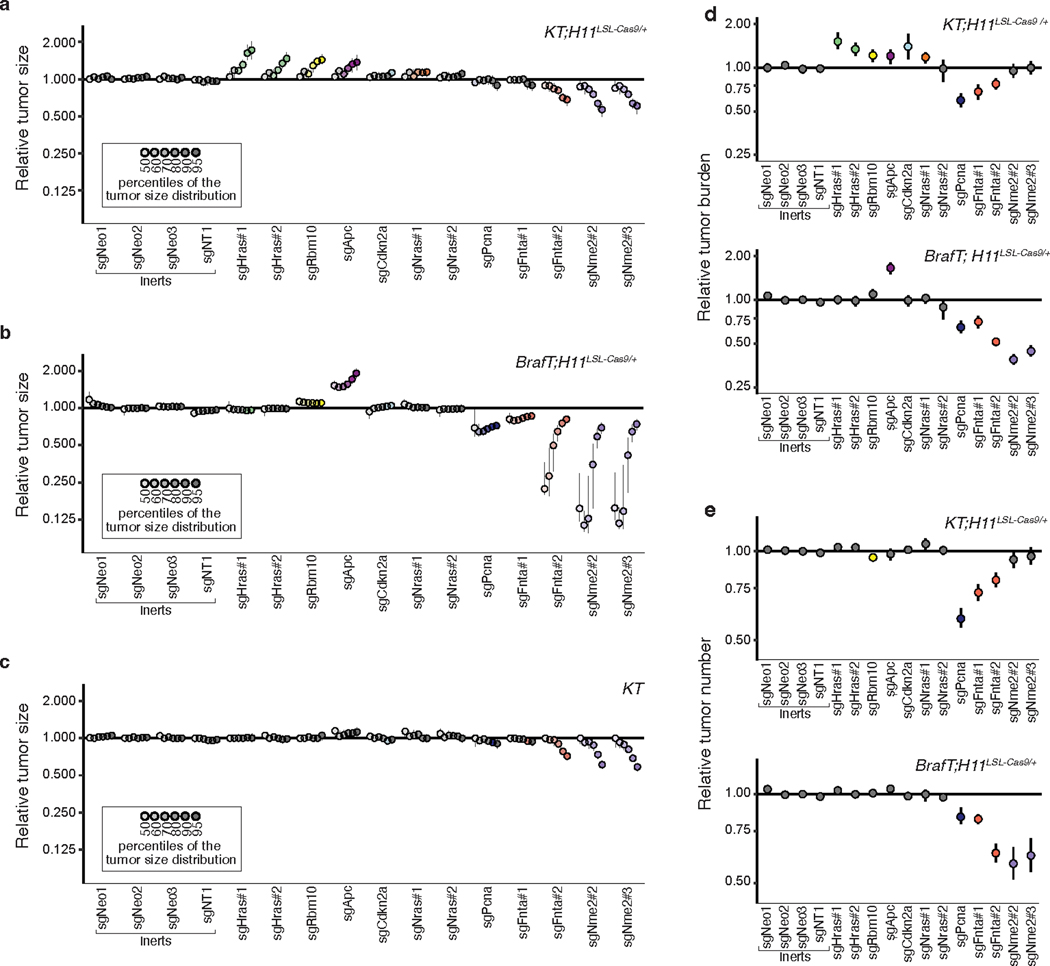
Extended Data Fig. 10. Paired screen in KRAS-driven and BRAF-driven lung cancer models validates HRAS and NRAS as KRAS-specific tumor suppressors.
a-c. Points denote tumor sizes at indicated percentiles for each sgRNA relative to the size of sgInert-containing tumors at the corresponding percentiles in KT;H11LSL-Cas9/+ (a), BrafT;H11LSL-Cas9/+ (b) and KT mice (c). Genes are ordered by 95th percentile tumor size in KT;H11LSL-Cas9/+ mice, with sgInerts on the left. Percentiles that are significantly different from sgInert (two-sided FDR-adjusted p < 0.05) are in color. The negative effects of sgRNAs targeting Fnta and Nme2 in the KT mice (c) are unexpected and indicate a potential bias in the size distributions of tumors with these genotypes. We note that the same bias may be present in the KT;H11LSL-Cas9/+ and BrafT;H11LSL-Cas9/+ data; however, previous experiments showed consistent negative effects on tumor size for these sgRNAs, suggesting that the observed effects in this KT;H11LSL-Cas9/+ cohort are not solely the product of this bias. d. Points denote the impact of each sgRNA on tumor burden relative to sgInerts in KT;H11LSL-Cas9/+ and BrafT;H11LSL-Cas9/+ mice, normalized to the corresponding statistic in KT mice to account for representation of each sgRNA in the viral pool. Relative tumor burdens significantly different from sgInert (two-sided FDR-adjusted p < 0.05) are in color. e. Points denote the impact of each sgRNA on tumor number relative to sgInerts in KT;H11LSL-Cas9/+ and BrafT;H11LSL-Cas9/+ mice, normalized to the corresponding statistic in KT mice to account for representation of each sgRNA in the viral pool. Relative tumor numbers significantly different from sgInert (two-sided FDR-adjusted p < 0.05) are in color. For all panels: Error bars indicate 95% confidence intervals around point estimates of the test statistic. sgInerts are in gray and the line at y = 1 indicates no effect relative to sgInerts. Confidence intervals and P-values were calculated using the nested bootstrap resampling approach described in the Methods across 11 KT;H11LSL-Cas9/+ mice, 14 BrafT;H11LSL-Cas9/+ mice and 10 KT mice.

