Fig 1.
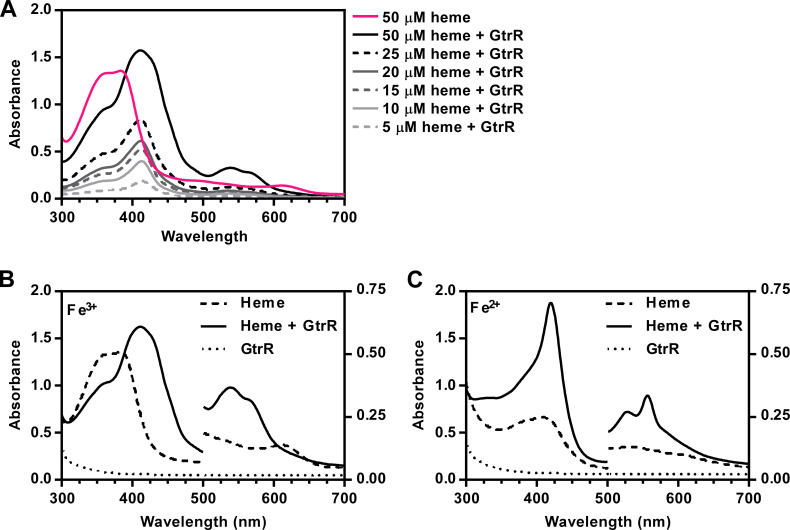
S. aureus GtrR binds heme in vitro. (A) Absorption spectra of heme in solution and in the presence of purified WT GtrR in dialysis buffer. The spectrum corresponding to 50 µM free heme is shown as a solid pink line. Increasing concentrations of heme (5–50 µM, in grayscale from light to dark) were incubated in the presence of 5 µM purified protein. (B and C) Absorption spectra of heme in dialysis buffer (B) and after reduction with the addition of excess dithionite (C). Absorbance values at wavelengths below 500 nm are plotted on the left Y axis and absorbance values above 500 nm are plotted on the right Y axis for visualization of α/β bands.

