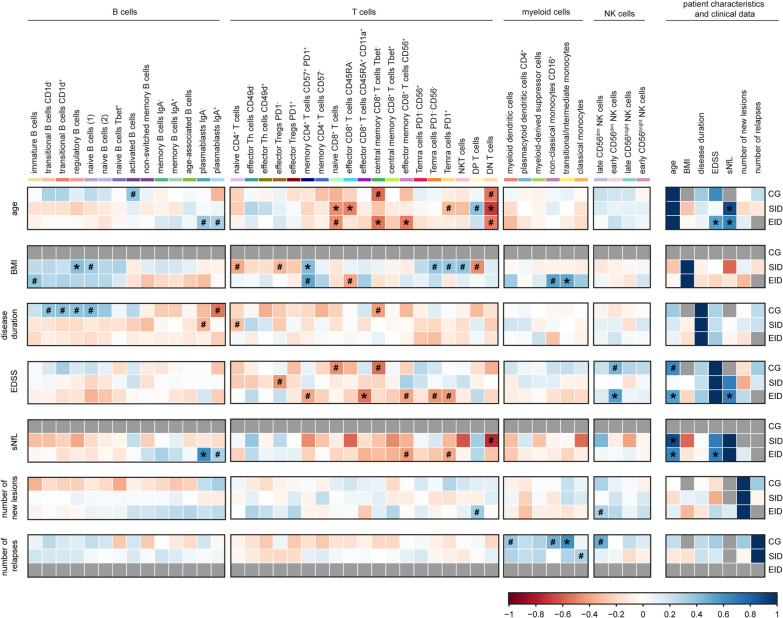
Fig. 5.
Repopulated B cell subsets do not correlate with the number of relapses nor radiological activity. Heatmap indicates the Spearman correlation values between each annotated immune cell subset and patient characteristics and clinical data. Colour key represents positive (blue) and negative (red) correlation. Grey colour indicates that no correlation was measured, either because less than 10 data point were included or because all values were the same. *adjusted p-value < 0.05, #unadjusted p-value < 0.05. Th T helper cells, Tregs regulatory T cells, Temra T effector memory re-expressing CD45RA cells, NKT natural killer T cells, DN double negative, DP double positive cells, NK natural killer cells, BMI body mass index, EDSS expanded disability status scale, sNfL serum neurofilament light, CG control group, SID standard interval dosing, EID extended interval dosing

