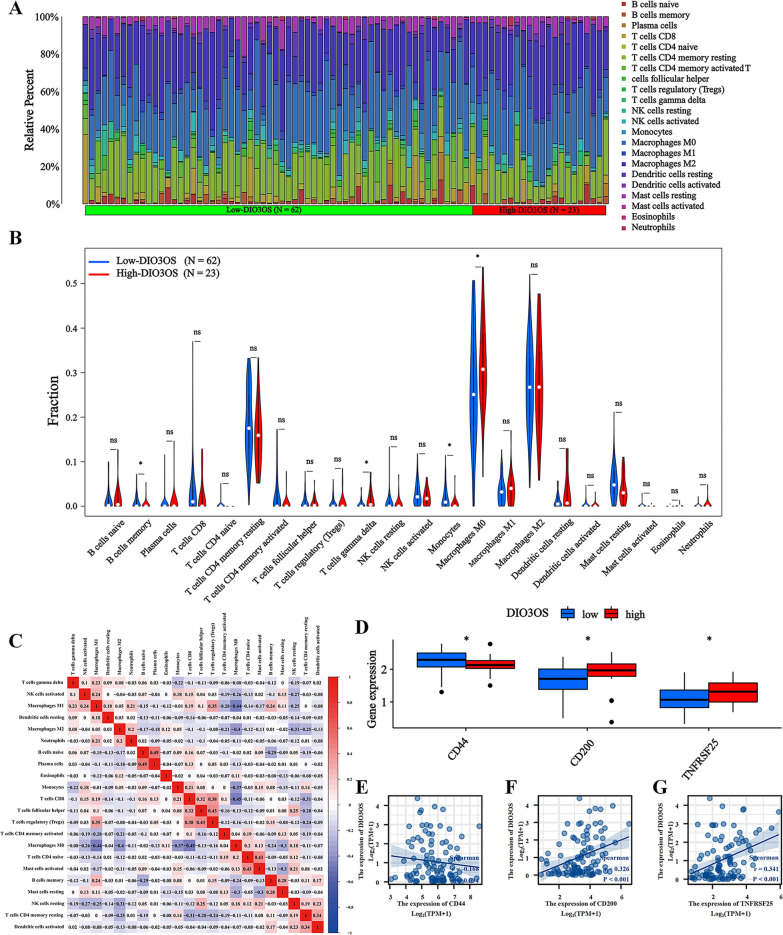
Fig. 4.
Immune related analysis. A The mean proportion of 22 immune cells in the Target database. B Violin diagram of the difference in expression of 22 immune cells infiltration between the high and low expression groups of DIO3OS in 85 osteosarcoma samples in the TARGET set. Blue represents the low expression group, red represents the high expression group. C Correlation heat map of 22 immune cells in the TARGET set. D In low expression of DIO3OS group, CD200 and TNFRSF25 expression were inhibited and CD44 expression were increased. E–G Scatter plots of the expression correlation between CD44, CD200, and TNFRSF25 and DIO3OS. P-value of less than 0.05 is considered statistically significant (ns, p > 0.05; *, p < 0.05; **, p < 0.01; ***, p < 0.001; ****, p < 0.0001)

