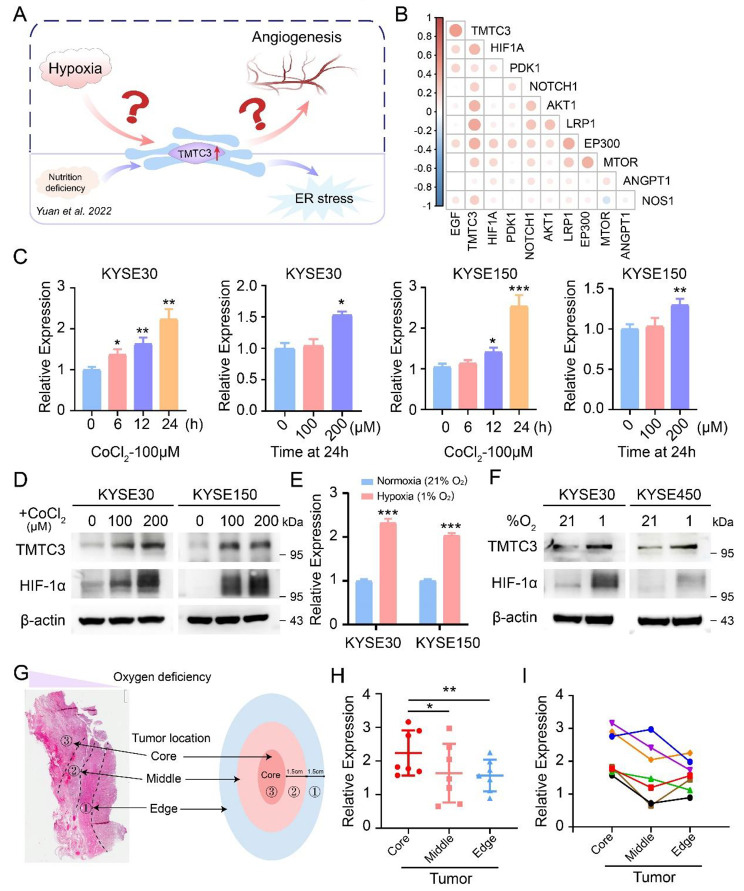
Fig. 1.
Increased expression of TMTC3 under hypoxic conditions. (A) Schematic diagram depicting the aim of this study. (B) Cross correlation analysis of TMTC3 expression and genes in HIF-1α pathway from TCGA database. C and D. ESCC cells were treated by CoCl2 with different concentration for 24 h or 100 µM CoCl2 for different times. The TMTC3 mRNA levels (C) and protein levels (D) were detected. E and F. ESCC cells were cultured in a hypoxia oxygen incubator for 24 h, and mRNA expression (E) and protein expression (F) were analyzed. G. Schematic diagram depicting the tumor locations of ESCC. H. The expression of TMTC3 at different tumor location in ESCC (n = 7). I. The expression of TMTC3 in each group tissue of ESCC. Each color represents a group of samples from the same patient (n = 7). All data are expressed as the mean ± SD. *, p < 0.05; **, p < 0.01; ***, p < 0.001. n = 3

