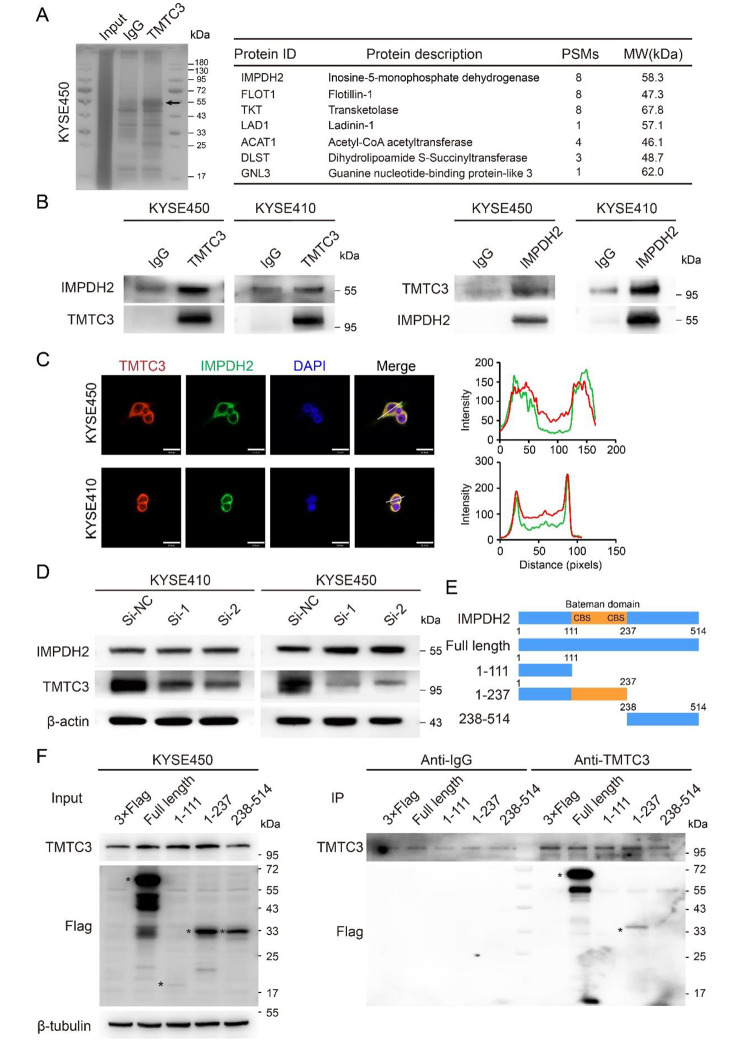
Fig. 3.
Identifying the interaction between TMTC3 and the Bateman domain of IMPDH2. (A) Proteins that interacted with TMTC3 were detected by silver staining SDS-PAGE gel and mass spectrometry. The representative proteins in the differential band around 55 kDa were analyzed and listed. (B) The interaction between TMTC3 and IMPDH2 was validated by co-immunoprecipitation assays with anti-TMTC3 or anti-IMPDH2 antibody or IgG, respectively. (C) Immunofluorescence assay was performed on KYSE450 and KYSE410 cells with the antibodies indicated on the top. Plots of pixel intensity along the white line from the images, colors as in merged images. Scale bars, 30 μm. (D) The effect on IMPDH2 expression in TMTC3 knockdown cells was detected by western blot assay. (E) Schematic representation of IMPDH2 truncated mutants. (F) Indicated Flag-tagged IMPDH2 mutants were transfected into KYSE450 cells, followed by immunoprecipitation with anti-TMTC3 antibody and immunoblotting with anti-Flag antibody

